Introduction to Data Science
STAT 220
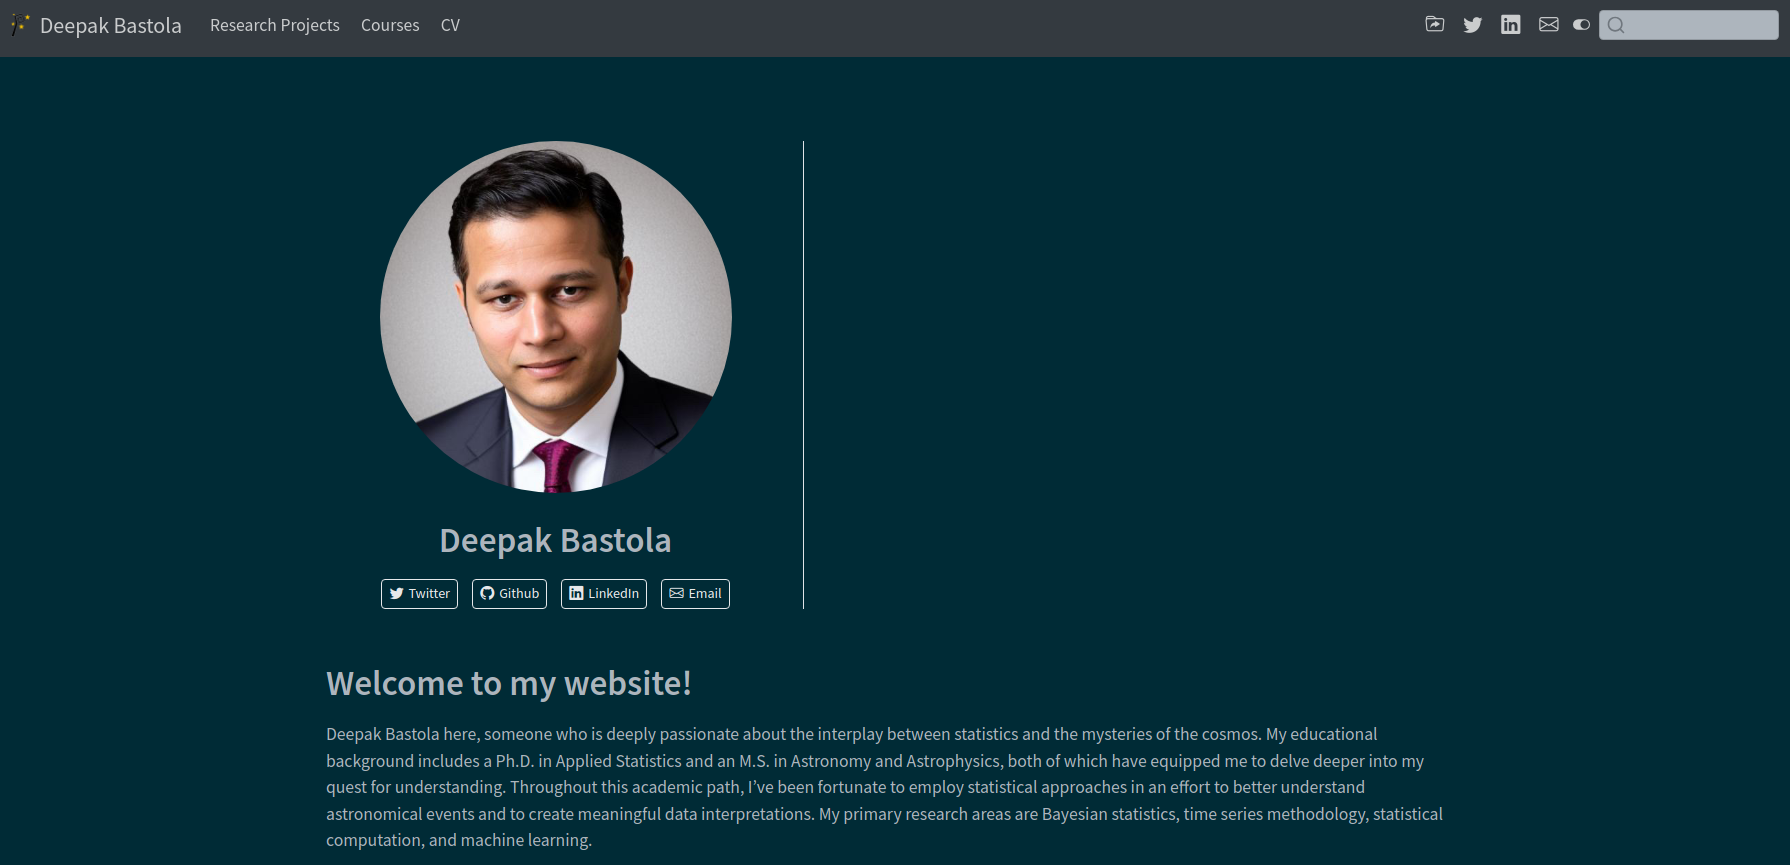
Something about me
- Third year at Carleton
- Originally from Nepal
- Research in Bayesian computation and machine learning
- Avid learner and traveler
Data Science in a Nutshell
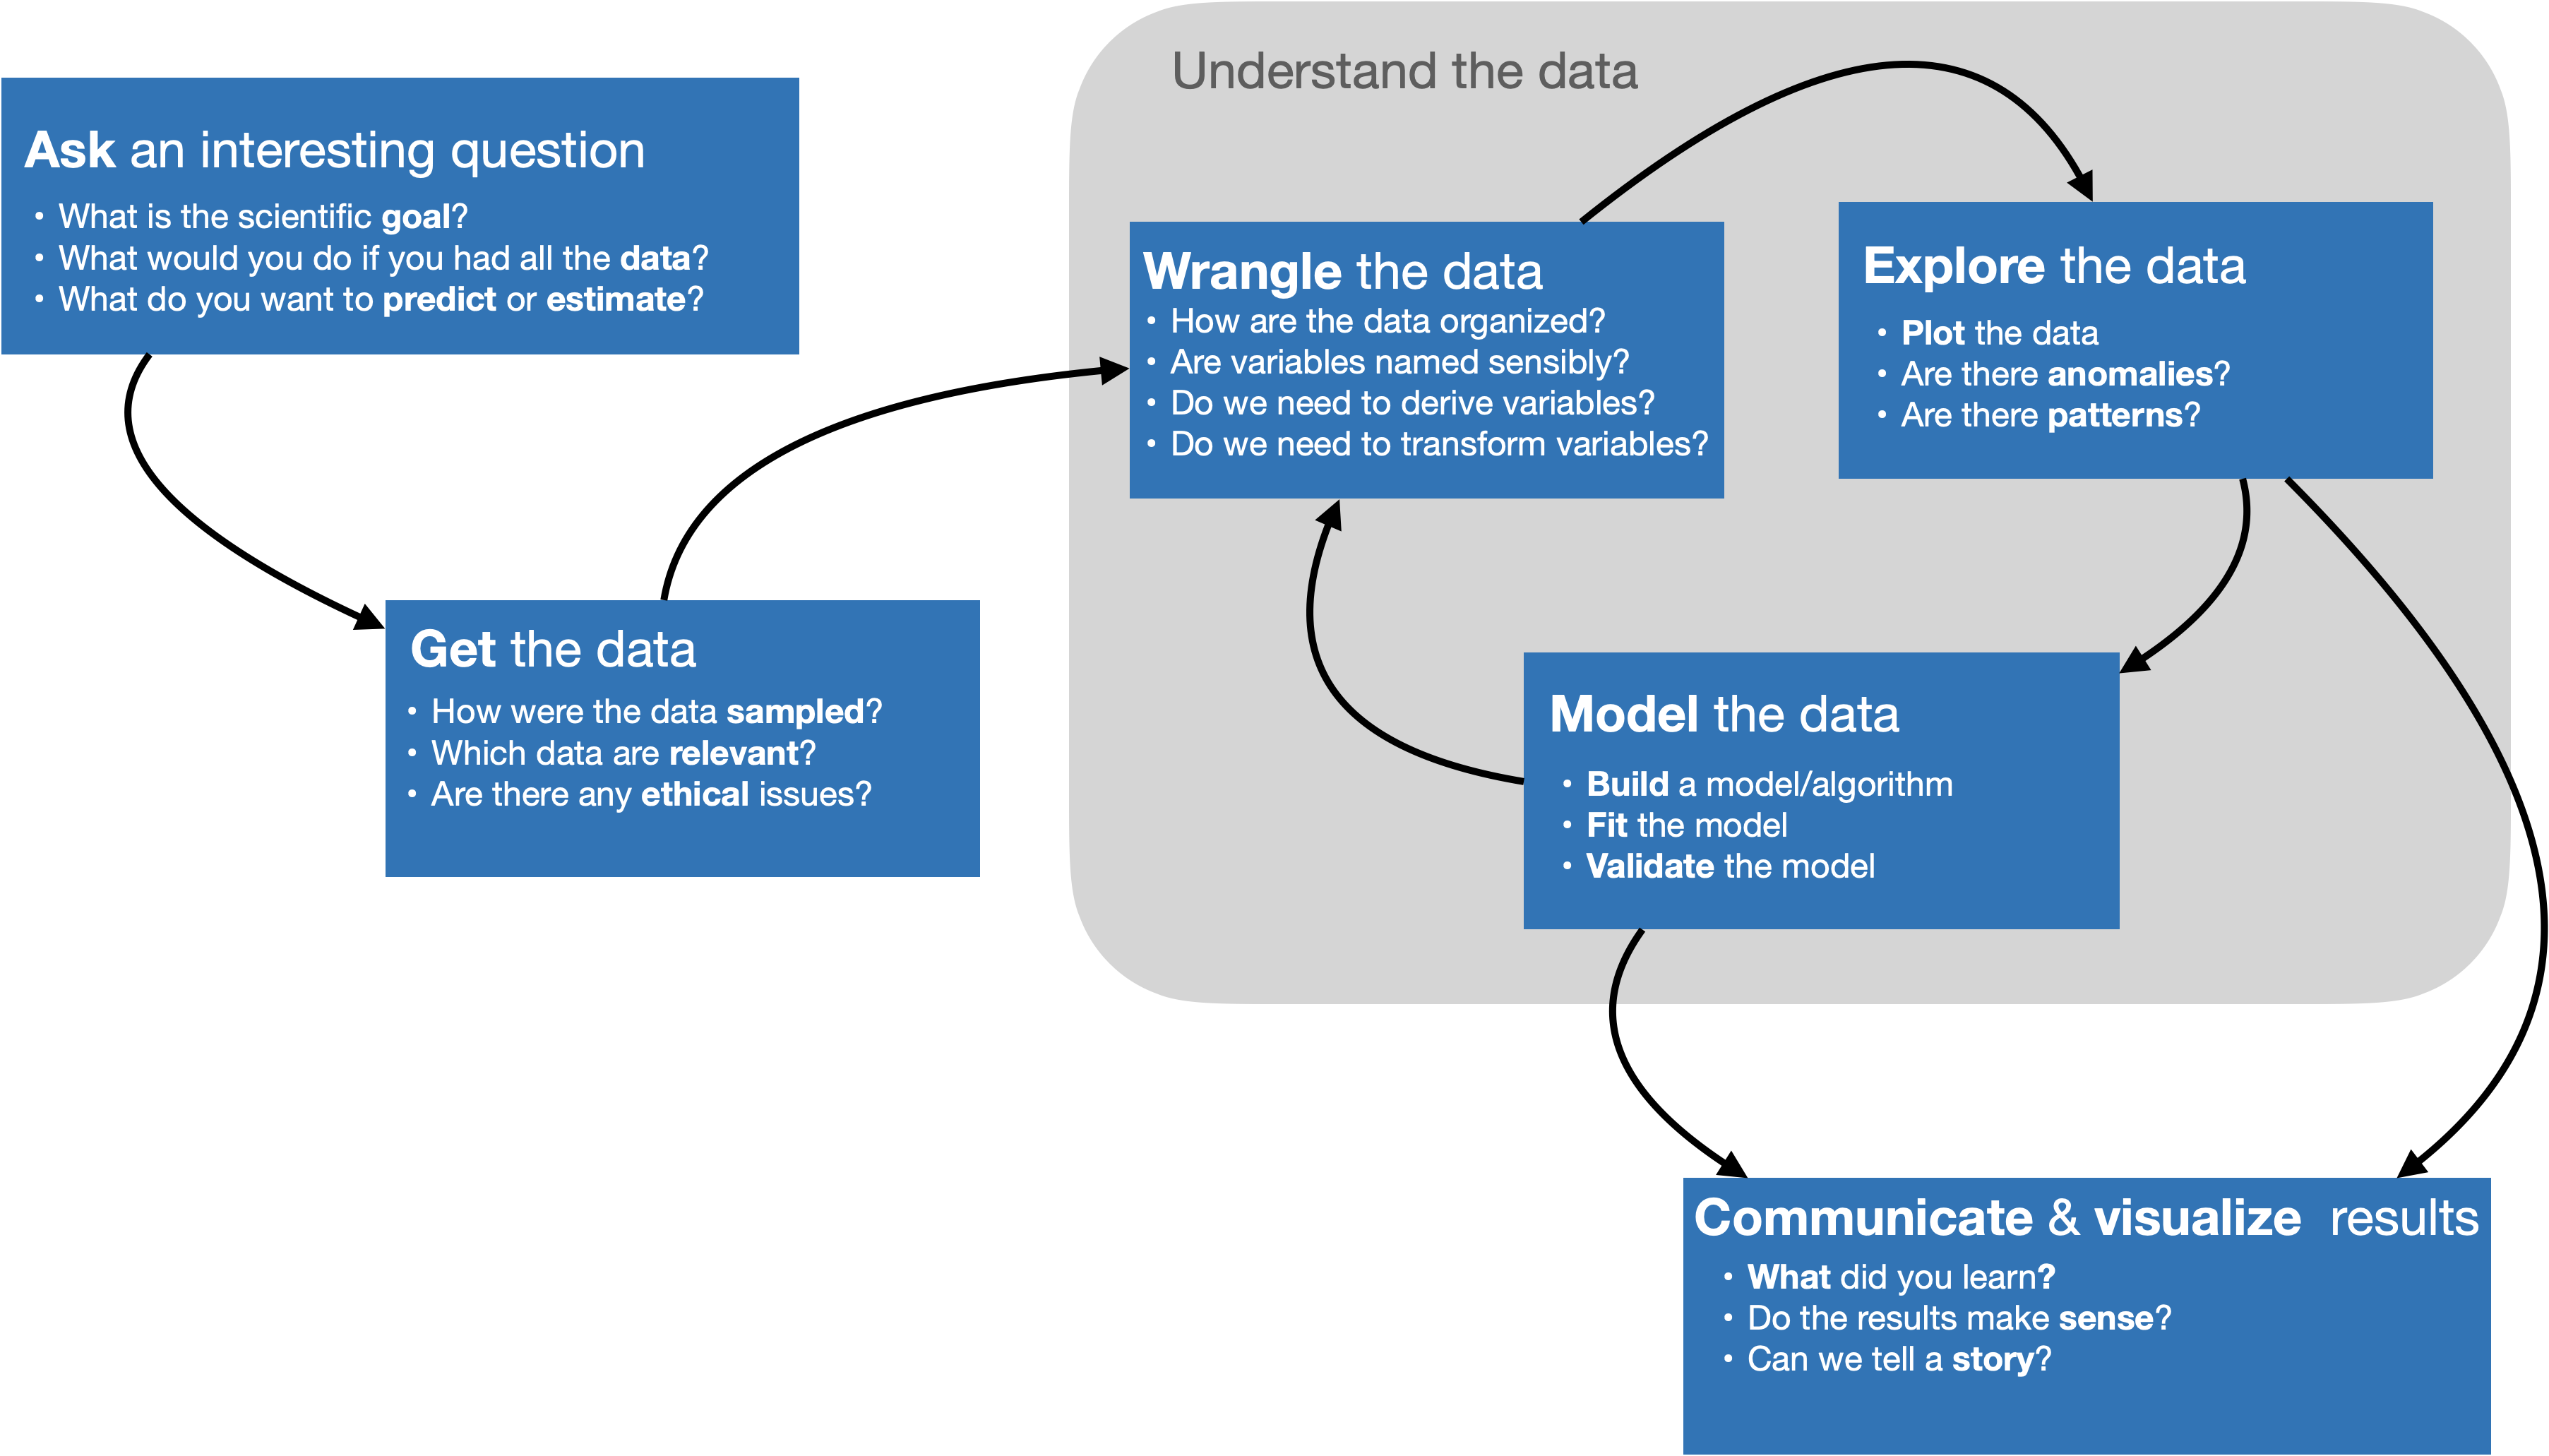
Image adapted from work of Joe Blitzstein, Hanspeter Pfister, and Hadley Wickham
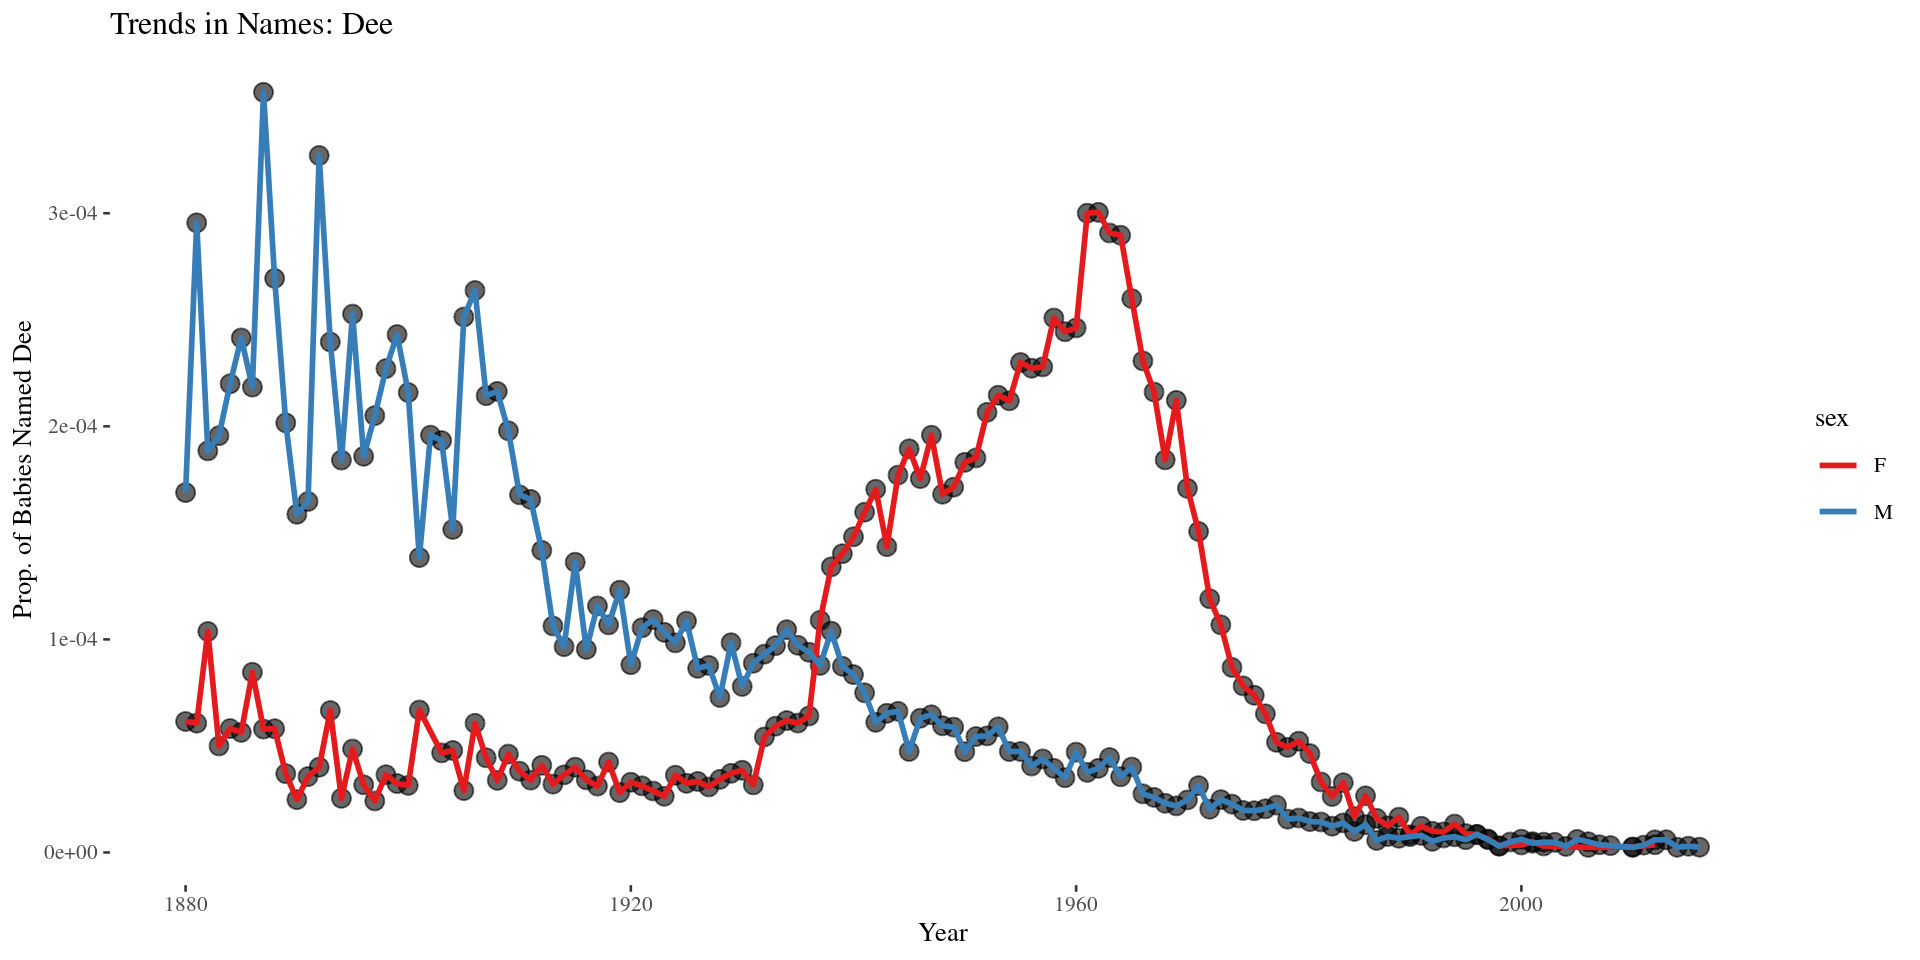
Gendered language in professor reviews
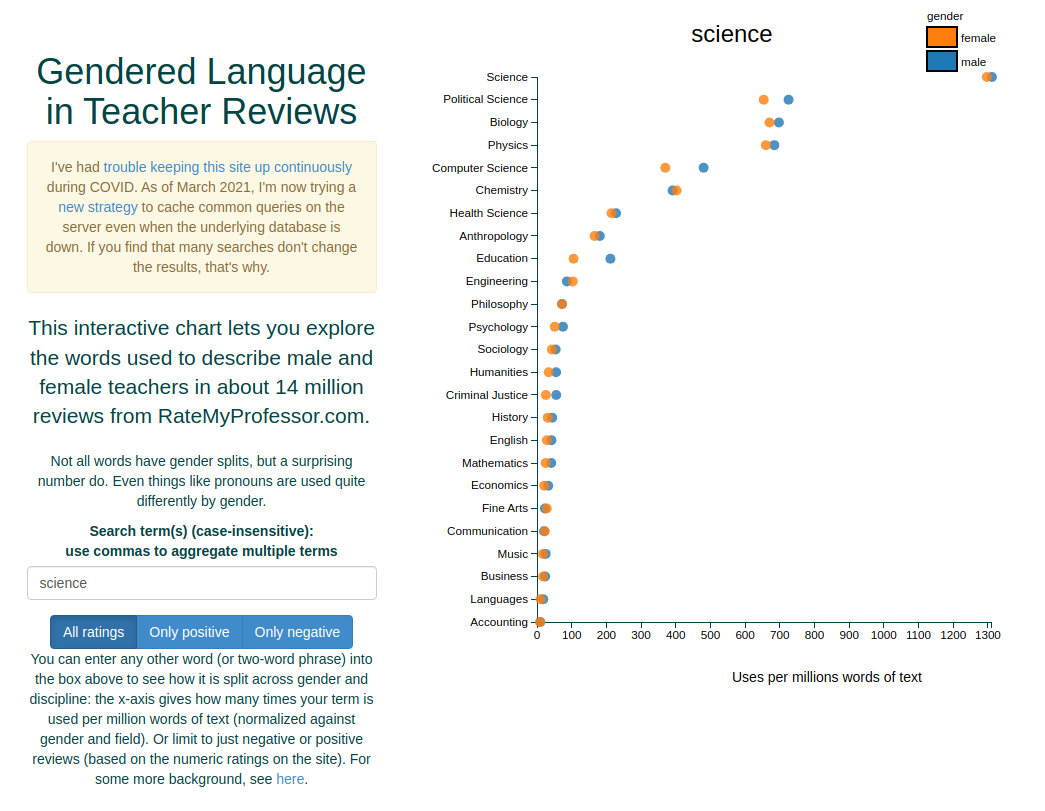
Rate my professor reviews
Using R Markdown for Data Science
- In this class, we will use R Markdown for all our work, leveraging its comprehensive support for data science projects.
- A R Markdown document (
.Rmd) integrates:- R code for dynamic analysis and visualization.
- Descriptive text
- Compiling (rendering) a
.Rmdfile produces various output formats- Documents: PDF, HTML, Word.
- Presentations: HTML-based slides, PDF slides via Beamer.
- Interactive content: Web dashboards, interactive visualizations.
- R Markdown is engineered with reproducibility as a core principle, facilitating transparent and repeatable research workflows.
- The presentations for this class is made using Quarto Markdown
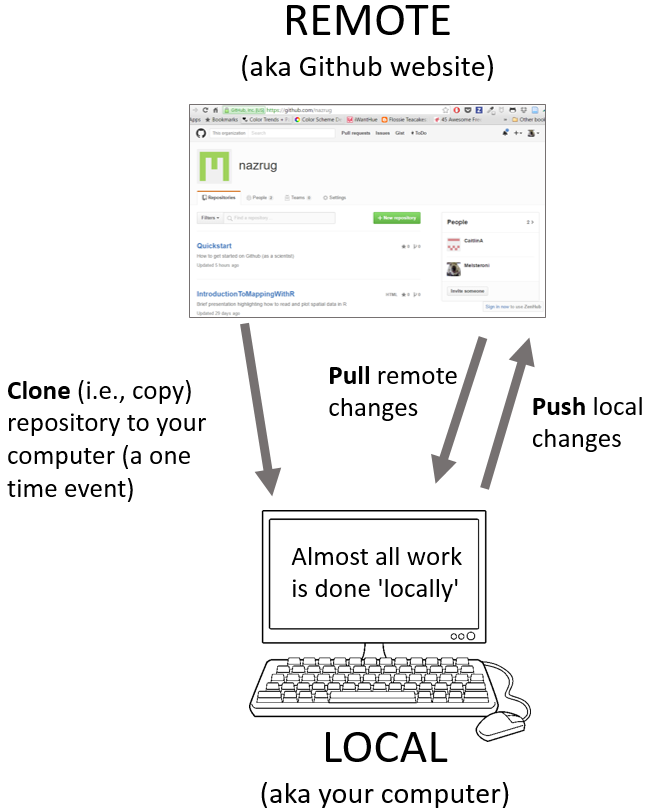
Version Control using Git and GitHub
- User: A Github account for you (e.g., deepbas).
- Organization: The Github account for one or more user (e.g., DataScienceSpring24).
- Repository: A folder within the organization that includes files dedicated to a project.
- Local Github: Copies of Github files located your computer.
- Remote Github: Github files located on the https://github.com website.
- Clone: Process of making a local copy of a remote Github repository.
- Pull: Copy changes on the remote Github repository to your local Github repository.
- Push: Save local changes to remote Github
Using GitHub and Posit for data science
- Integrate R Markdown with GitHub for version control:
- Create a GitHub repository.
- Clone the repo and set up a R Markdown project in RStudio.
- Work with various files (
.Rmd,.r,.csv, etc.). - Commit changes locally and push to GitHub.
- Pull updates from others into your local workspace.
R Markdown enhances the workflow by seamlessly integrating executable code with narrative text, making your data science projects reproducible and collaborative.
Group Activity 1

- Make a course folder called ‘stat220’ either on your Maize account or on your local computer
- Please download the Class-Activity-1 template from moodle and go to class helper web page
10:00