Iteration and functionals

STAT 220

Bastola

Why repeat ourselves?

tinydata <- tribble(
  ~case, ~x, ~y, ~z, 
  "a", 5, 3, -2,
  "b", 7, 1, -5,
  "c", 9, 12, -3
)
tinydata
# A tibble: 3 × 4
  case      x     y     z
  <chr> <dbl> <dbl> <dbl>
1 a         5     3    -2
2 b         7     1    -5
3 c         9    12    -3

Find the mean of each columns

mean(tinydata$x)
[1] 7
mean(tinydata$y)
[1] 5.333333
mean(tinydata$z)
[1] -3.333333

It would be nice to iterate this process so that the same function/operation can be ran multiple times

For loops

What is a For loop?

  • A for loop is a way to iterate through a series of items stored as a data object in R.


items <- c("grapes", "bananas", "chocolate", "bread")
for (i in items) {
  print(i)
}
[1] "grapes"
[1] "bananas"
[1] "chocolate"
[1] "bread"

for loop components

the for() function is used to specify

  • what object we’re drawing from and
  • what object we are writing to
for(i  in  items)
     ^        ^
     |        |
     |        |___ object we are drawing from
     |
     |
obj. we write each item to

for loop components

The brackets {}

  • Inside the brackets we house the code that is going to happen each iteration


for( i  in  items  ){
  |~~~~~~~~~~~~~~~~|   
  |~~~~~~~~~~~~~~~~|
  |~~~~~~~~~~~~~~~~| code we need perform on each iteration.
  |~~~~~~~~~~~~~~~~|
  |~~~~~~~~~~~~~~~~|
  }

for loops tinydata

tinydata
# A tibble: 3 × 4
  case      x     y     z
  <chr> <dbl> <dbl> <dbl>
1 a         5     3    -2
2 b         7     1    -5
3 c         9    12    -3
  • Let’s iterate calculation of column means:
my_means <- rep(NA, 3)   # initialize an empty vector
for (i in 1:3) {  # three columns to get the mean for
  my_means[i] <- mean(tinydata[[i+1]])  # mean of col. i+1 
}
my_means
[1]  7.000000  5.333333 -3.333333

Function for conditional evaluation

if x is numeric then standardize, else just return x

standardize <- function(x, ...){   # ... placeholder for optional args
  if (is.numeric(x)){              # condition
    (x - mean(x, ...))/sd(x, ...)  # if TRUE, standardize
  } else{                          # else (FALSE)
    x                              # return x unchanged
  }
}

standardize(c(2,4,6,8, 10))
[1] -1.2649111 -0.6324555  0.0000000  0.6324555  1.2649111
standardize(c(2,4,6,8, "10"))
[1] "2"  "4"  "6"  "8"  "10"
standardize(c(2,4,6,8, NA), na.rm = TRUE)
[1] -1.1618950 -0.3872983  0.3872983  1.1618950         NA

Standardizing tinydata

# allocate storage in a new data frame
scaled_tinydata <- tinydata %>% mutate(x = NA, y = NA,  z = NA)
for (i in seq_along(tinydata)){ 
    scaled_tinydata[, i] <- standardize(tinydata[[i]])
}
scaled_tinydata
# A tibble: 3 × 4
  case      x      y      z
  <chr> <dbl>  <dbl>  <dbl>
1 a        -1 -0.398  0.873
2 b         0 -0.740 -1.09 
3 c         1  1.14   0.218

 Group Activity 1


  • Please clone the ca15-yourusername repository from Github
  • Please do the problem 1 in the class activity for today

10:00

Functionals

Functional function will apply the same operation (function) to each element of a vector, matrix, data frame or list.

  • base-R: apply family of commands
  • purrr package: map family of commands

apply family of commands

R has a family of commands that apply a function to different parts of a vector, matrix or data frame

lapply(X, FUN): applies FUN to each element in the vector/list X

Example: lapply(tinydata, FUN = mean)

sapply(X, FUN): works like lapply, but returns a vector

Example: sapply(tinydata, FUN = mean)

purrr package

powerful package for iteration with the same functionality as apply commands, but more readable
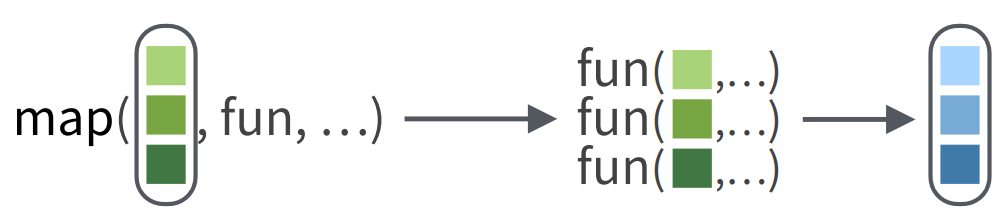
  • map(.x, .f) maps the function .f to elements in the vector/list .x

lapply with tinydata


lapply(tinydata, FUN = mean)
$case
[1] NA

$x
[1] 7

$y
[1] 5.333333

$z
[1] -3.333333
  • a 3x4 data frame is summarized in a list of length 4.
  • R sees tinydata as a list whose elements are column vectors (variables)
  • the FUN is applied to each list element
  • a list is returned
  • length is the number of variables in the data frame

purrr::map

In purrr, the map function is equivalent to lapply

library(purrr)
map(tinydata, .f = mean)
$case
[1] NA

$x
[1] 7

$y
[1] 5.333333

$z
[1] -3.333333

purrr::map_dbl

map_dbl is equivalent to sapply

map_dbl(tinydata, .f = mean)
     case         x         y         z 
       NA  7.000000  5.333333 -3.333333 
sapply(tinydata, FUN = mean)
     case         x         y         z 
       NA  7.000000  5.333333 -3.333333 

purrr::map_df

map_df returns a data frame instead of a vector

map_df(tinydata, .f = mean)
# A tibble: 1 × 4
   case     x     y     z
  <dbl> <dbl> <dbl> <dbl>
1    NA     7  5.33 -3.33
  • No equivalency in base-R apply!

Functionals: single function that mutates

standardize function gives us a list of standardized values

tinydata
# A tibble: 3 × 4
  case      x     y     z
  <chr> <dbl> <dbl> <dbl>
1 a         5     3    -2
2 b         7     1    -5
3 c         9    12    -3
lapply(tinydata, FUN = standardize)
$case
[1] "a" "b" "c"

$x
[1] -1  0  1

$y
[1] -0.3982161 -0.7395442  1.1377602

$z
[1]  0.8728716 -1.0910895  0.2182179
  • a 3x4 data frame is mutated to a list of 4 vectors of length 3 each

purrr::map_df

In purrr, the map_df is equal to lapply + bind_cols:

tinydata
# A tibble: 3 × 4
  case      x     y     z
  <chr> <dbl> <dbl> <dbl>
1 a         5     3    -2
2 b         7     1    -5
3 c         9    12    -3
map_df(tinydata, .f = standardize)
# A tibble: 3 × 4
  case      x      y      z
  <chr> <dbl>  <dbl>  <dbl>
1 a        -1 -0.398  0.873
2 b         0 -0.740 -1.09 
3 c         1  1.14   0.218
  • a 3x4 data frame is mutated to [standardized] 3x4 data frame

applying multiple functions

  • Let’s get the 0.1 and 0.9 quantile for variables in tinydata
quantile(tinydata$x, probs = c(.1, .9))
10% 90% 
5.4 8.6 
quantile(tinydata$y, probs = c(.1, .9))
 10%  90% 
 1.4 10.2 
quantile(tinydata$z, probs = c(.1, .9))
 10%  90% 
-4.6 -2.2 
  • the function output is a vector of length 2 (same lengths as probs)

map_dfr: Getting Quantiles

tinydata %>% 
  select_if(is.numeric) %>% 
  map_dfr(
    .f = quantile, 
    probs = c(.1, .9), 
    .id = "variable") 
# A tibble: 3 × 3
  variable `10%` `90%`
  <chr>    <dbl> <dbl>
1 x          5.4   8.6
2 y          1.4  10.2
3 z         -4.6  -2.2

Optionally use .id to record the variable names from tinydata:

map_dfc: Getting Quantiles

tinydata %>% 
  select_if(is.numeric) %>% 
  map_dfc(
    .f = quantile, 
    probs = c(.1, .9))
# A tibble: 2 × 3
      x     y     z
  <dbl> <dbl> <dbl>
1   5.4   1.4  -4.6
2   8.6  10.2  -2.2

 Group Activity 2


  • Please do the remaining problems in the class activity.
  • Submit to Gradescope on moodle when done!

10:00