Introduction to Shiny
STAT 220
Bastola
Introducing Shiny
- A special R package for making your data interactive.
- Turns your analyses into interactive web apps.
Create and Host Interactive Dashboards
- Interactive Dashboards: Easily create dynamic dashboards in R. No web development skills required!
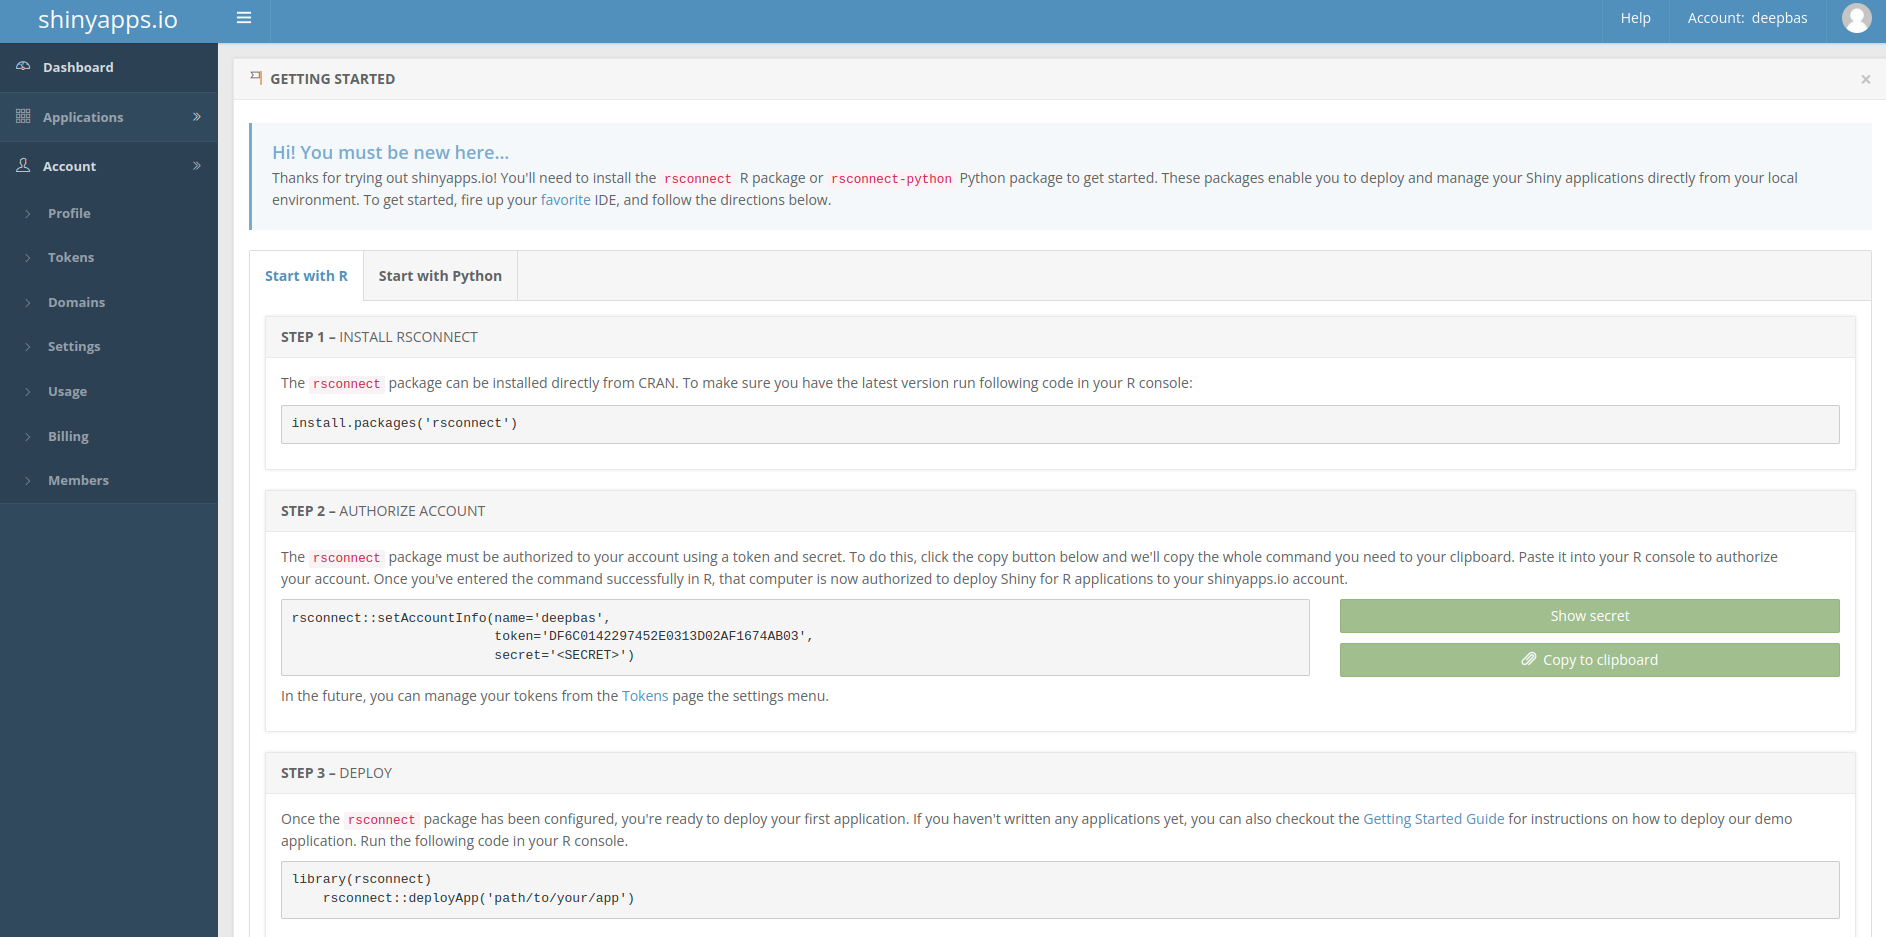
- Hosting Made Easy: Develop in RStudio and host your apps seamlessly on the web using RStudio’s servers.
- ShinyApps.io: Publish and share your interactive graphs and data analyses on ShinyApps.io, making your work accessible worldwide.
- ShinyLive Integration: Utilize ShinyLive for enhanced real-time interactions without server setup, directly running R applications in the browser.
Engaging Data Visualizations
- Interactive Visualizations: Shiny turns your static data into engaging experiences by allowing interactive graphs and tables.
- Responsive and Live Updates: Shiny listens to user inputs, updating outputs automatically to reflect changes, enhancing user experience and engagement.
- ShinyLive Features: Extend functionalities with ShinyLive, enabling more complex user interactions directly within web browsers, without the need for additional server resources.
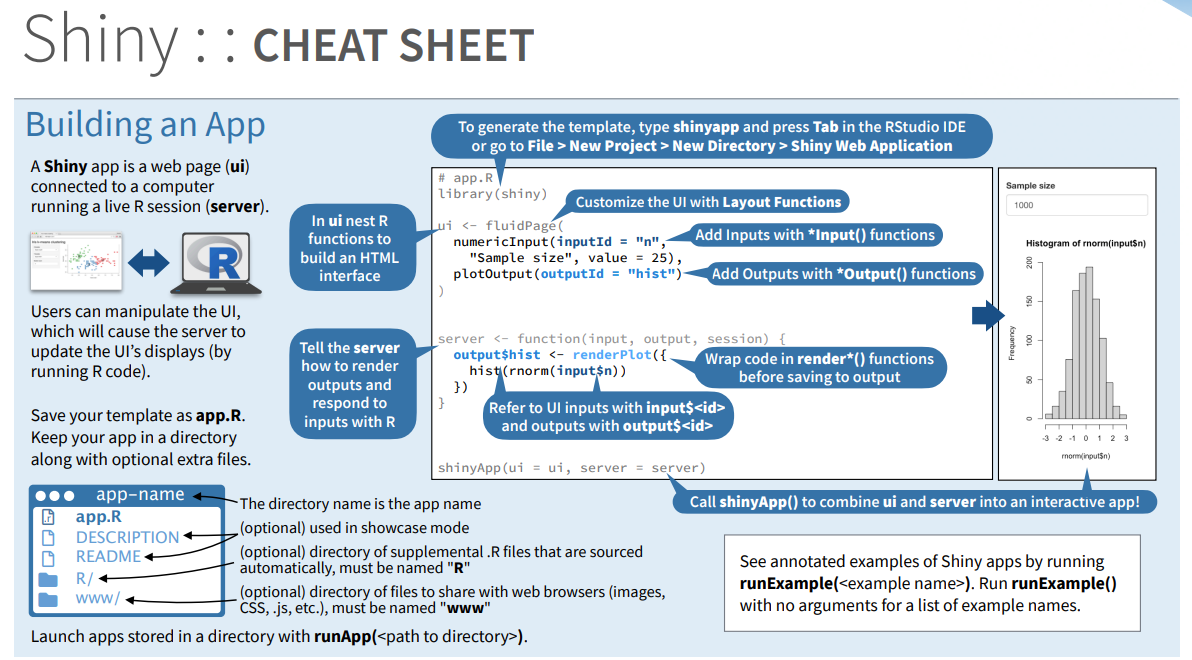
Building Blocks of a Shiny App
Every Shiny app has two main parts:
- User Interface (UI): What you see on the screen.
- Server Function: The brain behind the scenes doing the calculations.
You combine these with
shinyAppto make your interactive web app.To tell RStudio it’s a Shiny app, add
runtime: shinyto the top of your R Markdown file.
Useful Resources
Link here
Hello World
Add more information
Add a layout
Navigation Page layout
Tabset Panel Layout
ui <- fluidPage(
    titlePanel("My Tabbed App"),
    sidebarLayout(sidebarPanel("Inputs here"),
        mainPanel(tabsetPanel(
                tabPanel("Plot", plotOutput("plot")),
                tabPanel("Summary", verbatimTextOutput("summary")),
                tabPanel("Table", DTOutput("table")))))
)
server <- function(input, output) {}
shinyApp(ui = ui, server = server)
Using Shiny Themes
Input-Output Pairs
Group Activity 1

- Please clone the
ca18-yourusernamerepository from Github - Please do the problem 1 in the class activity for today
30:00