Interactive Graphs and Shiny Integration

STAT 220

Bastola

Spatial Data Analysis in R

sf (Simple Features)

  • Comprehensive Integration: Seamlessly handles spatial data within the tidyverse ecosystem, supporting complex spatial operations and integration with ggplot2 for advanced visualizations.

tigris

  • U.S. Geographic Detail: Directly accesses detailed U.S. Census Bureau shapefiles as sf objects, ideal for socio-economic and demographic studies.

rnaturalearth

  • Global Data Accessibility: Provides extensive global vector data from Natural Earth, ready for use with mapping tools like leaflet and ggplot2 for both interactive and static map creation.

library(sf)
library(tigris)
library(ggplot2)

ggplot(states()) +
  geom_sf(aes(fill = ALAND)) +
  coord_sf(xlim = c(-125, -66), ylim = c(25, 49), expand = FALSE) +
  labs(title = "US States by Land Area", fill = "Land Area") 
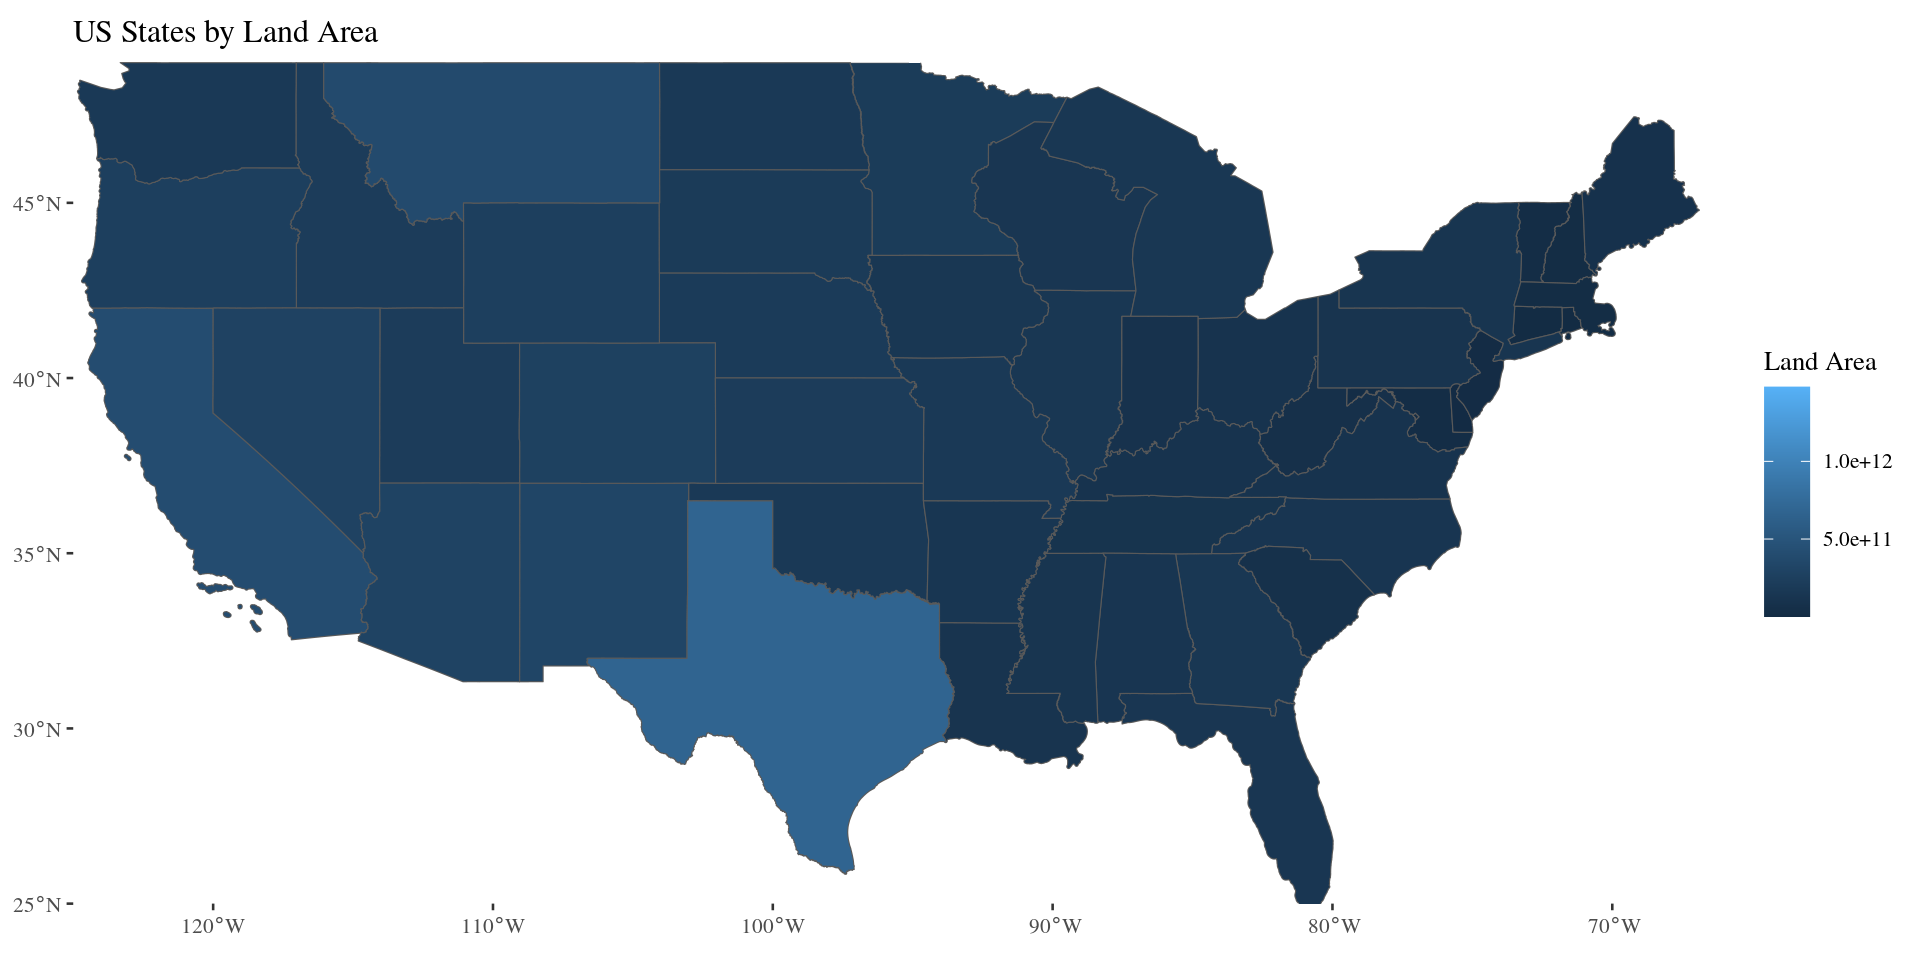
library(rnaturalearth)
library(sf)
library(ggplot2)
china_provinces <- ne_states(country = "China", returnclass = "sf")
ggplot(china_provinces) +
  geom_sf(fill = "lightblue", color = "black") +
  coord_sf(expand = FALSE) +
  labs(title = "Provinces of China") 

library(leaflet)
leaflet(china_provinces) %>%
  addProviderTiles(providers$OpenStreetMap) %>%  
  addPolygons(fillColor = ~colorQuantile("YlOrRd", diss_me, n = 5)(diss_me),  
              color = "black",
              weight = 1,
              opacity = 1,
              fillOpacity = 0.5,
              smoothFactor = 0.5,
              highlightOptions = highlightOptions(color = "white",
                                                  weight = 2,
                                                  bringToFront = TRUE),
              popup = ~paste(name_en))  

uk_regions <- ne_states(country = "United Kingdom", 
                        returnclass = "sf")
ggplot(uk_regions) +
  geom_sf(fill = "lightgreen", color = "black") +
  coord_sf(expand = FALSE) +
  labs(title = "Regions of the United Kingdom")

uk_regions <- ne_states(country = "United Kingdom", returnclass = "sf")

leaflet(uk_regions) %>%
  addProviderTiles(providers$OpenStreetMap) %>%  
  addPolygons(fillColor = ~colorQuantile("YlOrRd", diss_me, n = 5)(diss_me), 
              color = "black",
              weight = 1,
              opacity = 1,
              fillOpacity = 0.5,
              smoothFactor = 0.5,
              highlightOptions = highlightOptions(color = "white", weight = 2,
                                                  bringToFront = TRUE),
              popup = ~paste(name_en))  

Data Preparation

Map Data

states_sf <- states() %>% 
  mutate(state = str_to_lower(NAME))

Numeric Data

# Reading and preprocessing the COVID data
covid_final <- read_html("https://usafacts.org/visualizations/covid-vaccine-tracker-states/state/minnesota") %>%
  html_elements(css = "table") %>%
  html_table() %>%
  .[[1]] %>%
  janitor::clean_names() %>%
  mutate(across(2:4, parse_number)) %>%
  mutate(state = str_to_lower(state))

# find mismatches
setdiff(states_sf$state, covid_final$state)
[1] "united states virgin islands"                
[2] "commonwealth of the northern mariana islands"
[3] "guam"                                        
[4] "american samoa"                              
[5] "puerto rico"                                 


# discard these for more cohesive plot
c("alaska", "hawaii", setdiff(states_sf$state, covid_final$state))
[1] "alaska"                                      
[2] "hawaii"                                      
[3] "united states virgin islands"                
[4] "commonwealth of the northern mariana islands"
[5] "guam"                                        
[6] "american samoa"                              
[7] "puerto rico"                                 

Final data

states_sf <- left_join(states_sf, covid_final, by = ("state"))
states_sf
Simple feature collection with 56 features and 18 fields
Geometry type: MULTIPOLYGON
Dimension:     XY
Bounding box:  xmin: -179.2311 ymin: -14.60181 xmax: 179.8597 ymax: 71.43979
Geodetic CRS:  NAD83
First 10 features:
   REGION DIVISION STATEFP  STATENS GEOID STUSPS           NAME LSAD MTFCC
1       3        5      54 01779805    54     WV  West Virginia   00 G4000
2       3        5      12 00294478    12     FL        Florida   00 G4000
3       2        3      17 01779784    17     IL       Illinois   00 G4000
4       2        4      27 00662849    27     MN      Minnesota   00 G4000
5       3        5      24 01714934    24     MD       Maryland   00 G4000
6       1        1      44 01219835    44     RI   Rhode Island   00 G4000
7       4        8      16 01779783    16     ID          Idaho   00 G4000
8       1        1      33 01779794    33     NH  New Hampshire   00 G4000
9       3        5      37 01027616    37     NC North Carolina   00 G4000
10      1        1      50 01779802    50     VT        Vermont   00 G4000
   FUNCSTAT        ALAND      AWATER    INTPTLAT     INTPTLON          state
1         A  62266298634   489204185 +38.6472854 -080.6183274  west virginia
2         A 138961722096 45972570361 +28.3989775 -082.5143005        florida
3         A 143778561906  6216493488 +40.1028754 -089.1526108       illinois
4         A 206232627084 18949394733 +46.3159573 -094.1996043      minnesota
5         A  25151992308  6979074857 +38.9466584 -076.6744939       maryland
6         A   2677763359  1323686988 +41.5964850 -071.5264901   rhode island
7         A 214049931578  2391569647 +44.3484222 -114.5588538          idaho
8         A  23190115212  1025971768 +43.6726907 -071.5843145  new hampshire
9         A 125933327733 13456093195 +35.5397100 -079.1308636 north carolina
10        A  23872569964  1030754609 +44.0589536 -072.6710173        vermont
   percent_of_population_with_at_least_one_dose percent_fully_vaccinated
1                                          66.7                     59.1
2                                          81.4                     68.6
3                                          78.1                     70.3
4                                          77.5                     71.0
5                                          90.0                     78.3
6                                          95.0                     86.1
7                                          63.0                     55.7
8                                          84.8                     69.7
9                                          89.2                     65.0
10                                         95.0                     83.9
   percent_with_booster_or_additional_dose                       geometry
1                                     28.6 MULTIPOLYGON (((-80.85847 3...
2                                     29.4 MULTIPOLYGON (((-83.10874 2...
3                                     39.0 MULTIPOLYGON (((-89.17208 3...
4                                     43.4 MULTIPOLYGON (((-92.74568 4...
5                                     43.1 MULTIPOLYGON (((-75.76659 3...
6                                     48.8 MULTIPOLYGON (((-71.67881 4...
7                                     26.0 MULTIPOLYGON (((-111.0455 4...
8                                     35.0 MULTIPOLYGON (((-71.24548 4...
9                                     19.5 MULTIPOLYGON (((-76.91598 3...
10                                    54.0 MULTIPOLYGON (((-72.43462 4...

 Group Activity 1


  • Please clone the ca20-yourusername repository from Github
  • For the remainder of time, let’s practice building and deploying a leaflet Shiny app

30:00