# load the necessary libraries
library(tidyverse)
library(dplyr)
library(stringr)


energy <- read_csv("https://raw.githubusercontent.com/deepbas/statdatasets/main/energy.csv",
                    col_type = cols(
                     .default = col_double(),
                      Timestamp = col_datetime(format = ""),
                      dayWeek = col_factor(levels=c("Mon","Tues","Wed","Thurs","Fri","Sat","Sun"))
))Class Activity 15
Group Activity 1
a. if and for loop
Write a for loop to iterate over the columns of the ‘energy’ dataset and print the names of all columns containing the string “House”. Please use the function colnames() to extract the column names and store the results in a list.
Click for answer
Answer:
# Create an empty list to store the column names
house_columns <- list()

# Iterate over the columns of the 'energy' dataset
for (i in seq_along(colnames(energy))) {
  col_name <- colnames(energy)[i]

  # Check if the column name contains the string "House"
  if (str_detect(col_name, "House")) {
    # Add the column name to the list
    house_columns[[length(house_columns) + 1]] <- col_name
  }
}

# Print the list of house columns
house_columns <- unlist(house_columns)
house_columns
[1] "Allen_House" "Alumni_Guest_House/Johnson_House"
[3] "Benton_House" "Berg_House"
[5] "Bird_House" "Chaney_House"
[7] "Clader_House" "Dacie_Moses_House"
[9] "Douglas_House" "Farm_House"
[11] "Geffert_House" "Headley_House"
[13] "Henrickson_House" "Henry_House"
[15] "Hill_House" "Hilton_House"
[17] "Hoppin_House_(Alumni)" "Huntington_House"
[19] "Jewett_House" "Jones_House"
[21] "Nutting_House" "Page_House_West"
[23] "Parish_House_" "Parr_House"
[25] "Pollock_House" "Prentice_House"
[27] "Rayment_House" "Rice_House"
[29] "Rogers_House" "Ryberg_House"
[31] "Seccombe_House" "Sperry_House"
[33] "Stimson_House" "Strong_House"
[35] "Whittier_House" "Wilson_House" b. for loop and mean
Using a for loop, calculate and print the mean energy consumption of houses you identified in part a.
Click for answer
Answer:
# Assuming the house_columns vector from the previous step

# Create an empty numeric vector to store the mean energy consumption
mean_energy_consumption <- numeric()

# Iterate over the house_columns vector
for (house_col in house_columns) {
  # Calculate the mean energy consumption for the current house column
  mean_val <- mean(energy[[house_col]], na.rm = TRUE)

  # Add the mean energy consumption to the vector
  mean_energy_consumption <- c(mean_energy_consumption, mean_val)
}

# Combine the house names and mean energy consumption into a dataframe
house_mean_energy <- bind_cols(House = house_columns, MeanEnergyConsumption = mean_energy_consumption)

# Print the dataframe
house_mean_energy %>% knitr::kable()| House | MeanEnergyConsumption |
|---|---|
| Allen_House | 0.9821865 |
| Alumni_Guest_House/Johnson_House | 20.2631152 |
| Benton_House | 1.8849290 |
| Berg_House | 1.3174340 |
| Bird_House | 2.3222680 |
| Chaney_House | 1.0715123 |
| Clader_House | 0.4646776 |
| Dacie_Moses_House | 1.2776465 |
| Douglas_House | 0.7219500 |
| Farm_House | 5.0599020 |
| Geffert_House | 0.9360400 |
| Headley_House | 1.4555605 |
| Henrickson_House | 3.4407858 |
| Henry_House | 1.3639619 |
| Hill_House | 1.4735884 |
| Hilton_House | 0.4248030 |
| Hoppin_House_(Alumni) | 1.8760474 |
| Huntington_House | 1.2395238 |
| Jewett_House | 0.8987697 |
| Jones_House | 0.8680271 |
| Nutting_House | 4.3967234 |
| Page_House_West | 1.8923490 |
| Parish_House_ | 12.6793378 |
| Parr_House | 9.7210618 |
| Pollock_House | 1.1831426 |
| Prentice_House | 0.9089497 |
| Rayment_House | 0.8005664 |
| Rice_House | 1.1568457 |
| Rogers_House | 0.5634289 |
| Ryberg_House | 1.0729988 |
| Seccombe_House | 2.6874199 |
| Sperry_House | 0.7052983 |
| Stimson_House | 2.0659904 |
| Strong_House | 2.5410595 |
| Whittier_House | 1.0424369 |
| Wilson_House | 1.0435830 |
Group Activity 2
1. Make a data frame of quantiles for energy buildings in columns 9-90 (you will need na.rm = TRUE)
Click for answer
Answer:
qdf <- energy %>% select(9:90) %>%
  map_dfc(quantile, probs = seq(.1,.9,.1), na.rm = TRUE)
qdf
# A tibble: 9 × 82
`100_Nevada_Street` `104_Maple_St.` `106_Winona_St.` Allen_House
<dbl> <dbl> <dbl> <dbl>
1 0.0972 1.04 0.601 0.756
2 0.120 1.11 0.632 0.781
3 0.183 1.18 0.673 0.941
4 0.461 1.18 0.681 0.983
5 0.710 1.42 0.692 1.00
6 0.795 1.42 0.865 1.01
7 0.915 1.54 1.10 1.07
8 1.11 1.56 1.20 1.07
9 1.24 1.67 1.27 1.25
# ℹ 78 more variables: `Alumni_Guest_House/Johnson_House` <dbl>,
# Arboretum_Office <dbl>, Art_Studios <dbl>, Benton_House <dbl>,
# Berg_House <dbl>, Bird_House <dbl>, Boliou_Memorial_Art_Bldg. <dbl>,
# Burton_Hall <dbl>, `Cassat_Hall_/_James_Hall` <dbl>,
# `Center_for_Mathematics_&_Computing` <dbl>, Chaney_House <dbl>,
# Clader_House <dbl>, College_Warehouse <dbl>, Cowling_Gym <dbl>,
# Dacie_Moses_House <dbl>, Davis_Hall <dbl>, Douglas_House <dbl>, …2. Add a variable to identify the quantile
Click for answer
Answer:
qdf <- energy %>% select(9:90) %>%
  map_dfc(quantile, probs = seq(.1,.9,.1), na.rm = TRUE) %>%
  mutate(stat = str_c("quantile_", seq(10,90,10)))
qdf
# A tibble: 9 × 83
`100_Nevada_Street` `104_Maple_St.` `106_Winona_St.` Allen_House
<dbl> <dbl> <dbl> <dbl>
1 0.0972 1.04 0.601 0.756
2 0.120 1.11 0.632 0.781
3 0.183 1.18 0.673 0.941
4 0.461 1.18 0.681 0.983
5 0.710 1.42 0.692 1.00
6 0.795 1.42 0.865 1.01
7 0.915 1.54 1.10 1.07
8 1.11 1.56 1.20 1.07
9 1.24 1.67 1.27 1.25
# ℹ 79 more variables: `Alumni_Guest_House/Johnson_House` <dbl>,
# Arboretum_Office <dbl>, Art_Studios <dbl>, Benton_House <dbl>,
# Berg_House <dbl>, Bird_House <dbl>, Boliou_Memorial_Art_Bldg. <dbl>,
# Burton_Hall <dbl>, `Cassat_Hall_/_James_Hall` <dbl>,
# `Center_for_Mathematics_&_Computing` <dbl>, Chaney_House <dbl>,
# Clader_House <dbl>, College_Warehouse <dbl>, Cowling_Gym <dbl>,
# Dacie_Moses_House <dbl>, Davis_Hall <dbl>, Douglas_House <dbl>, …3. Reshape the data frame to make variables stat (describing the quantile), building and quant (quantile value)
Click for answer
Answer:
qdf <- energy %>% select(9:90) %>%
  map_dfc(quantile, probs = seq(.1,.9,.1), na.rm = TRUE) %>%
  mutate(stat = str_c("quantile_", seq(10,90,10))) %>%
  pivot_longer(names_to = "building", values_to = "quantiles", 1:82)
qdf
# A tibble: 738 × 3
stat building quantiles
<chr> <chr> <dbl>
1 quantile_10 100_Nevada_Street 0.0972
2 quantile_10 104_Maple_St. 1.04
3 quantile_10 106_Winona_St. 0.601
4 quantile_10 Allen_House 0.756
5 quantile_10 Alumni_Guest_House/Johnson_House 17.0
6 quantile_10 Arboretum_Office 0.13
7 quantile_10 Art_Studios 0.23
8 quantile_10 Benton_House 1.59
9 quantile_10 Berg_House 1.06
10 quantile_10 Bird_House 1.42
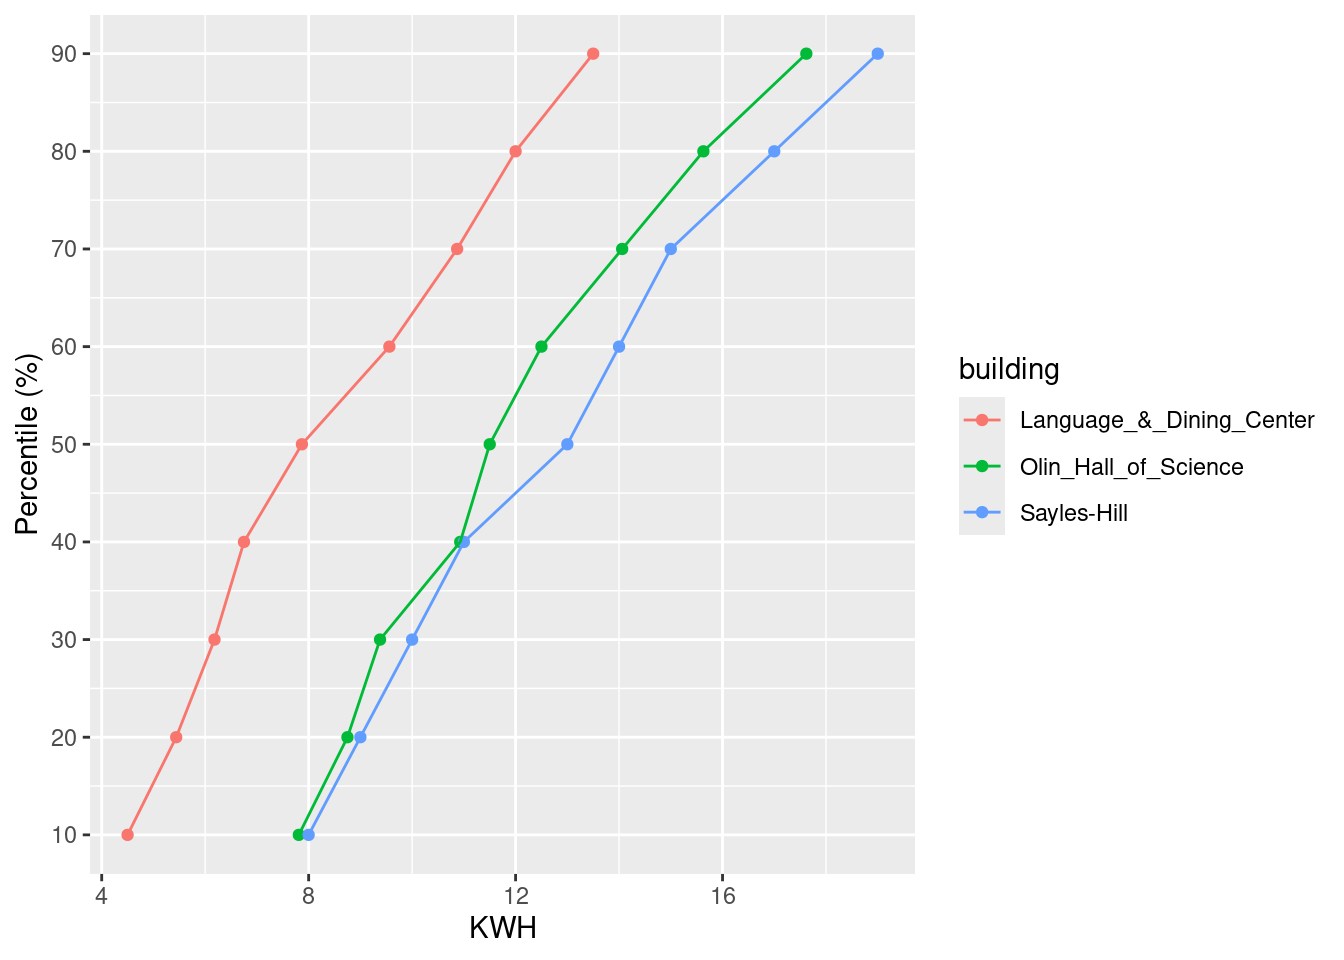
# ℹ 728 more rows4. Plot the KWH value for each quantile on the x-axis for the buildings Sayles-Hill, Language_&_Dining_Center, Olin_Hall_of_Science
Click for answer
Answer:
qdf %>%
  filter(building %in% c("Sayles-Hill" ,"Language_&_Dining_Center", "Olin_Hall_of_Science"))  %>%
  ggplot(aes(x=quantiles, y=parse_number(stat), color=building)) +
  geom_point() +
  geom_line(aes(group=building)) +
  labs(y="Percentile (%)",x="KWH") +
  scale_y_continuous(breaks=seq(10,90,by=10))