# load the necessary libraries
library(tidyverse)
library(ggthemes)
library(factoextra)
library(janitor)
library(broom)

select <- dplyr::select
theme_set(theme_stata(base_size = 10))


standardize <- function(x, na.rm = FALSE) {
  (x - mean(x, na.rm = na.rm)) / sd(x, na.rm = na.rm)
}Class Activity 26
Group Activity 1
Let’s look at the following data tibble that randomly creates some x- and y- coordinates around the cluster centroids that we just saw in class. Please answer the questions based on this data.
set.seed(1234)

my_df <- tibble(
  X1 = rnorm(n = 120, mean = rep(c(2, 4, 7.33), each = 40)),
  X2 = rnorm(n = 120, mean = rep(c(6.33, 3, 6), each = 40))
)

my_df %>%
  ggplot(aes(X1, X2)) +
geom_point() 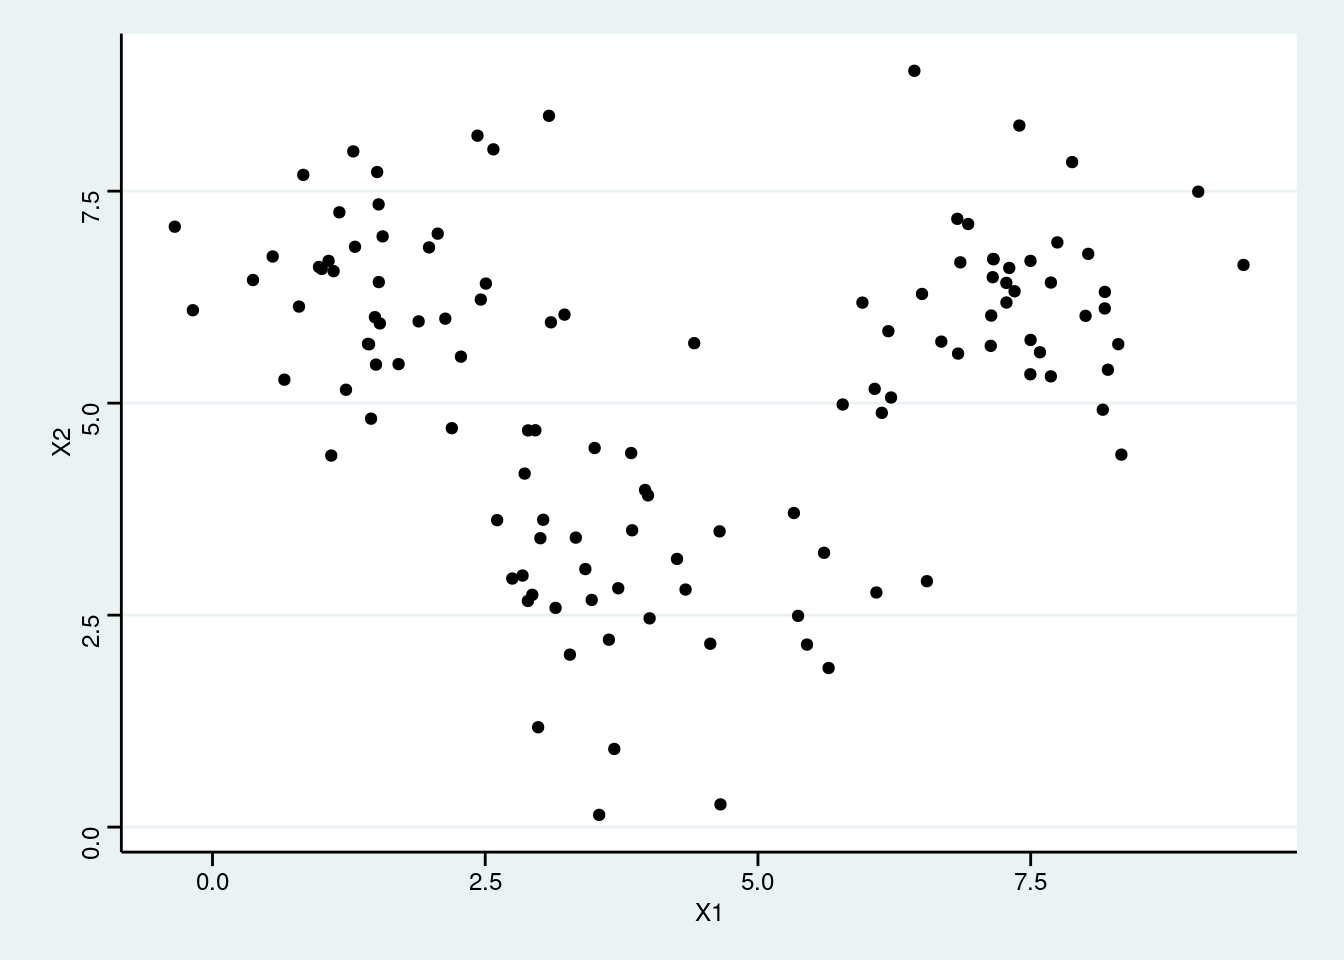
- How many clusters can you identify in the data?
Click for answer
Answer: Answers may vary
- Fit
kmeansalgorithm to the data picking the number of clusters you previously identified in parta.
Click for answer
Answer:
set.seed(1234)
res_kmeans <- kmeans(my_df, centers = 3, nstart = 25)- Add the cluster association to the dataset and make a scatter plot color-coded by the cluster association.
Click for answer
Answer:
augment(res_kmeans, data = my_df) %>%
  ggplot(aes(X1, X2, color = .cluster)) +
  geom_point()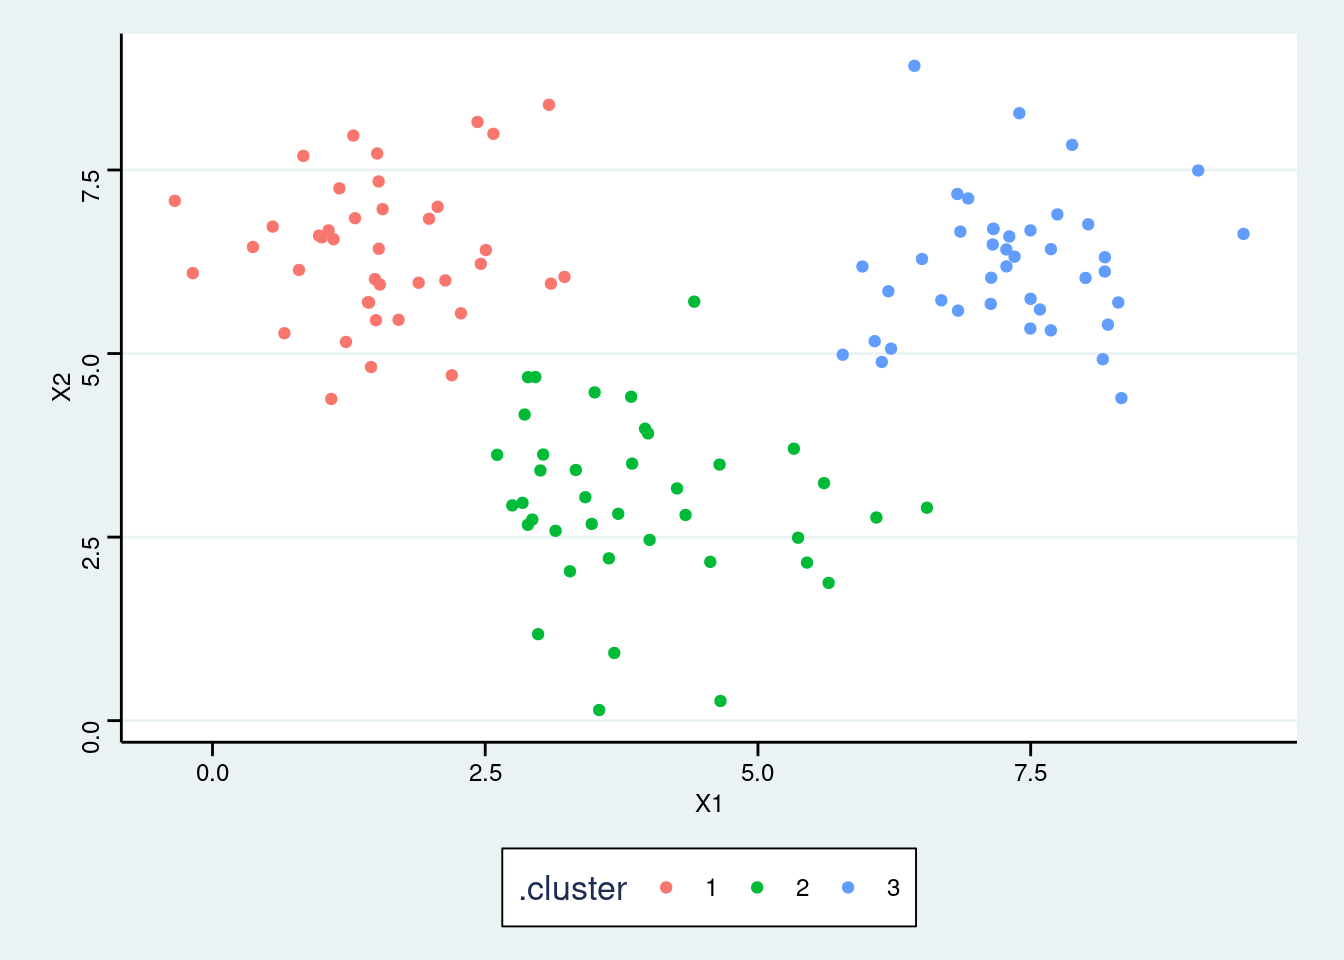
- Repeat parts
b-cfor identifying more number of clusters than what you picked in part a.
Click for answer
Answer:
set.seed(1234)
res_kmeans <- kmeans(my_df, centers = 5, nstart = 25)augment(res_kmeans, data = my_df) %>%
ggplot(aes(X1, X2, color = .cluster)) +
geom_point()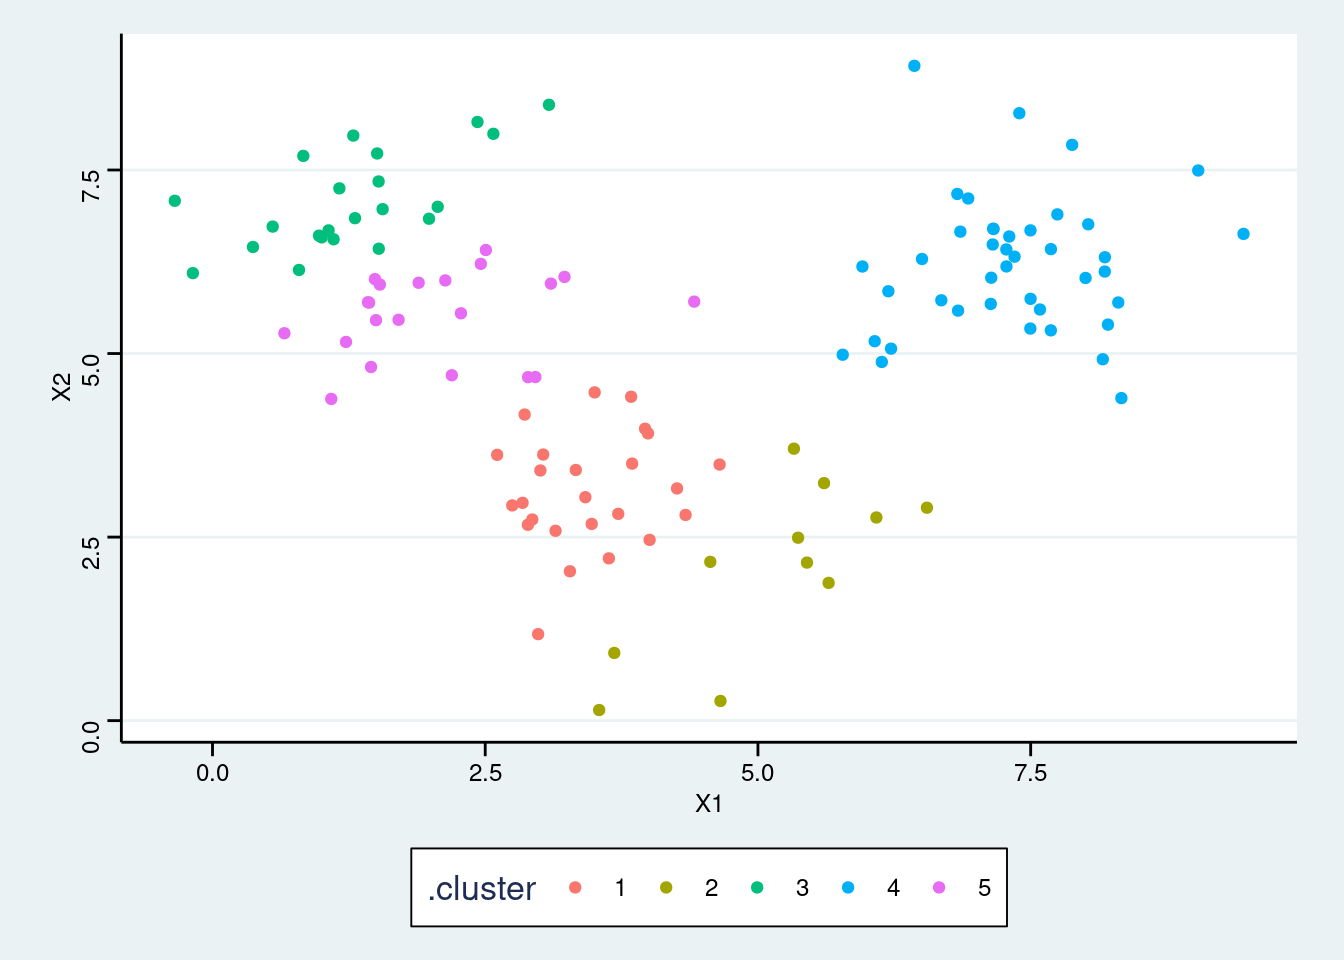
- Aggregate the total within sum of squares for each k to the data table
multi_kmeans.
Click for answer
Answer:
multi_kmeans <- tibble(k = 1:10) %>%
mutate(
model = purrr::map(k, ~ kmeans(my_df, centers = .x, nstart = 25)),
tot.withinss = purrr::map_dbl(model, ~ glance(.x)$tot.withinss)
)- Make an elbow plot modifying the code below:
Click for answer
Answer:
multi_kmeans %>%
ggplot(aes(k, tot.withinss)) +
geom_point() +
geom_line()+
scale_x_continuous(breaks = 1:15) 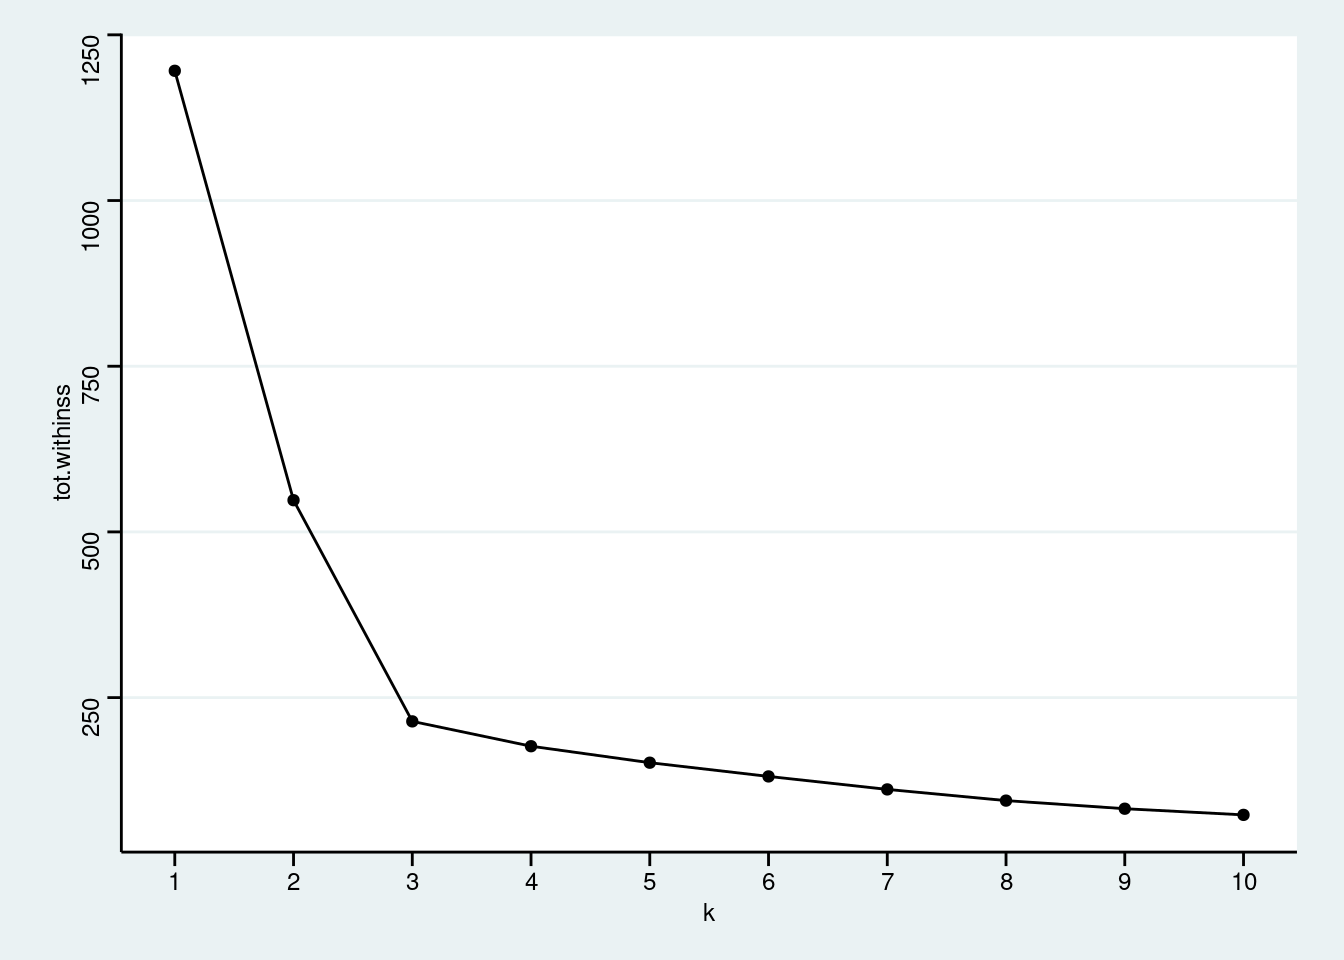
- After picking an optimal number of cluster, use the in-built function in the
factoextrapackage to construct the final cluster plot.
Click for answer
Answer:
set.seed(1234)
kmeans.final <- kmeans(my_df, 5, nstart = 25)
fviz_cluster(kmeans.final, data = my_df, ggtheme = theme_stata())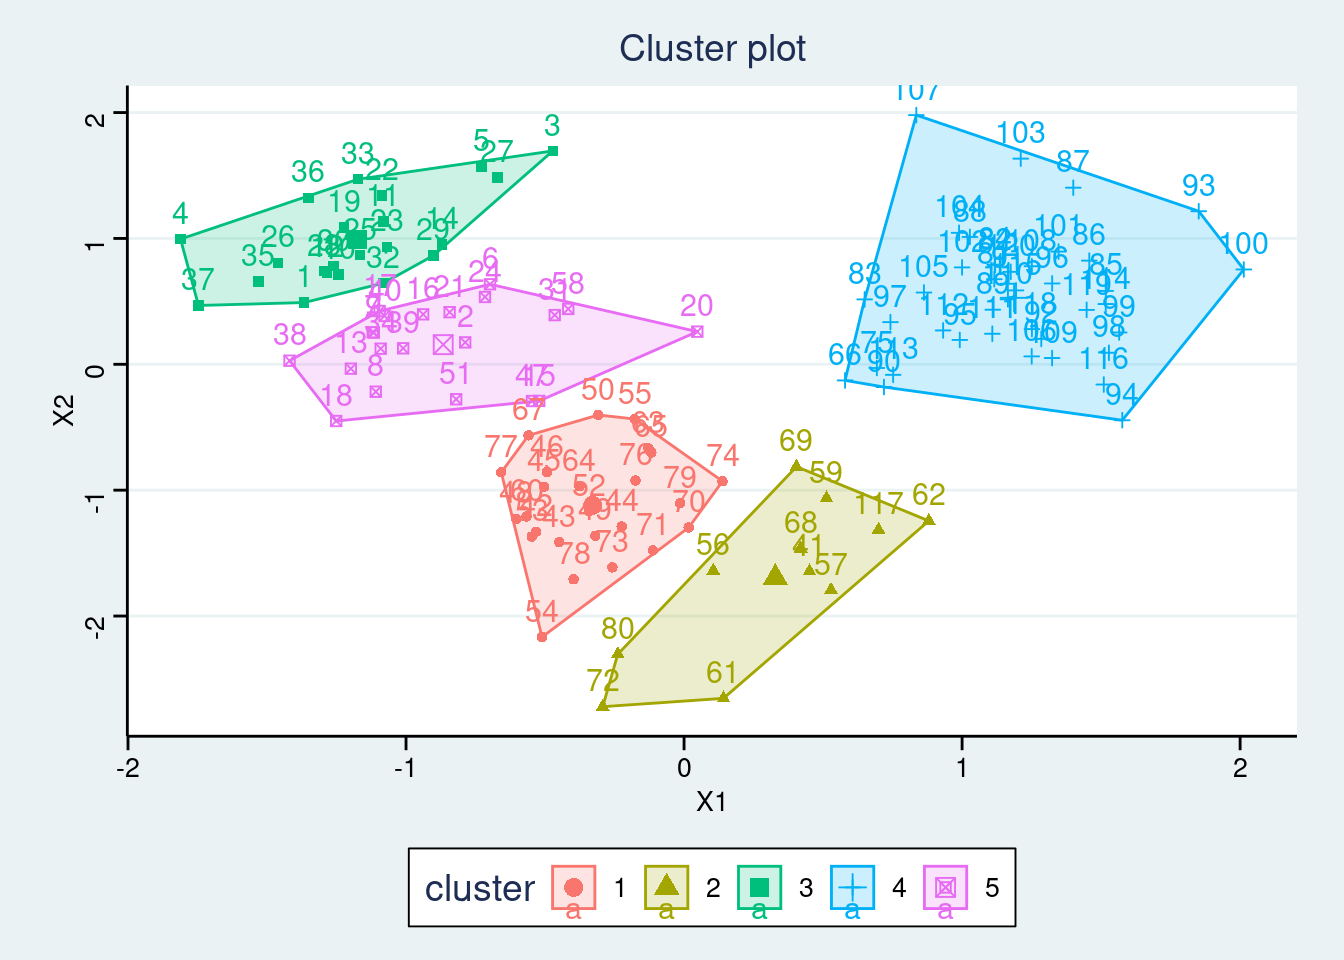
(Extra) Group Activity 2
Let’s look at the following data tibble that randomly creates some x- and y- coordinates around the cluster centroids. Now, there are more clusters and the data points are closer to each other. Please repeat the analysis as seen above to find the optimal number of clusters.
set.seed(1234)
my_df <- tibble(
X1 = rnorm(n = 240, mean = rep(c(2, 4, 7.33, 2.5, 5, 6), each = 40)),
X2 = rnorm(n = 240, mean = rep(c(6.33, 3, 6, 3.5, 4.5, 5.5), each = 40))
)
my_df %>%
ggplot(aes(X1, X2)) +
geom_point() 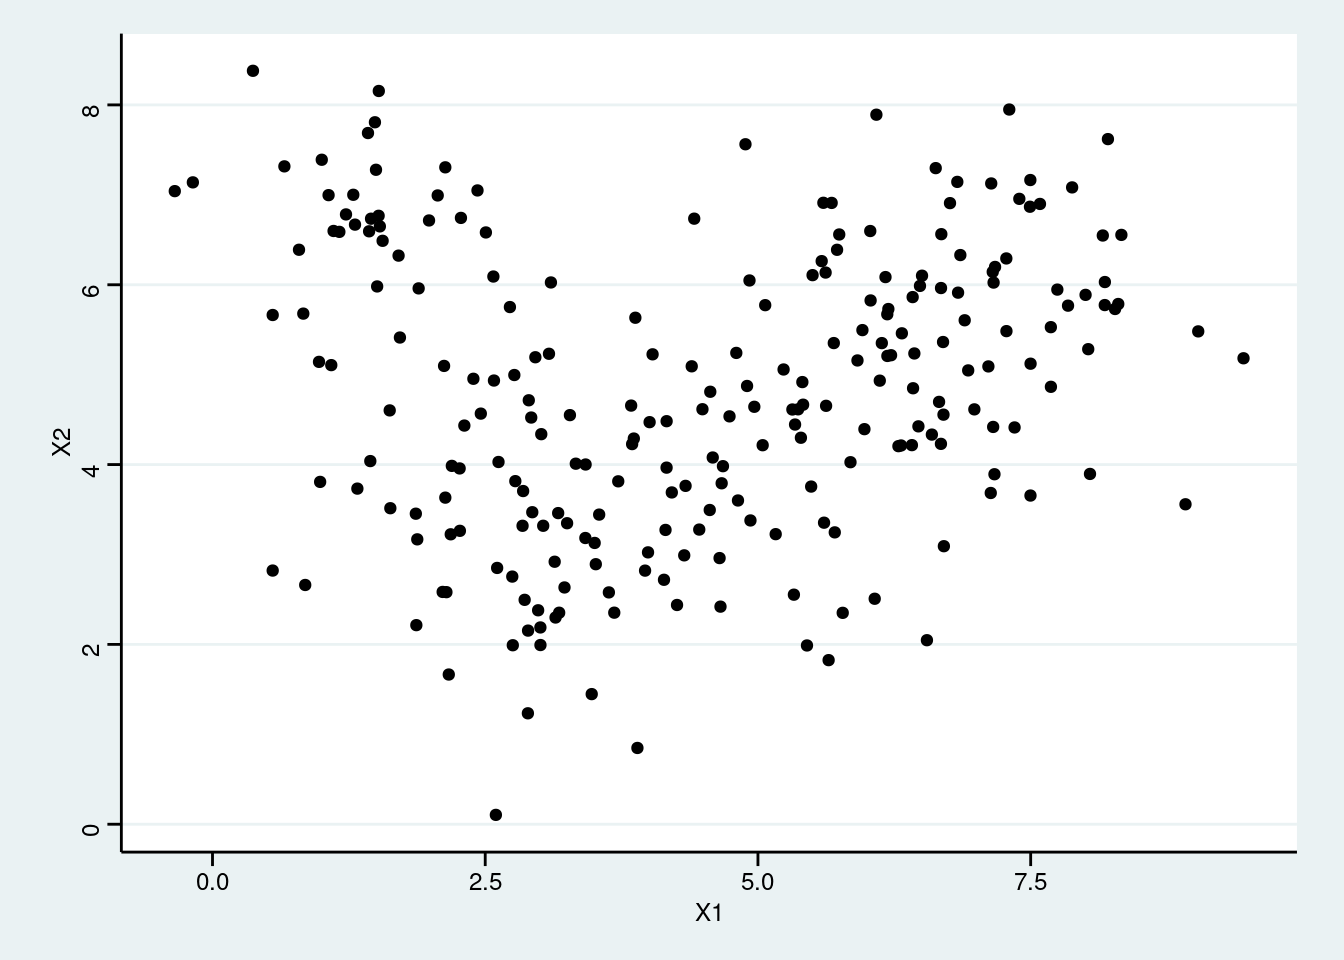
Click for answer
Answer:
- How many clusters can you identify in the data?
Answer: Answers may vary!
- Fit
kmeansalgorithm to the data picking the number of clusters you previously identified in part a.
set.seed(1234)
res_kmeans <- kmeans(my_df, centers = 6, nstart = 25)- Add the cluster association to the dataset and make a scatter plot color-coded by the cluster association.
augment(res_kmeans, data = my_df) %>%
  ggplot(aes(X1, X2, color = .cluster)) +
  geom_point()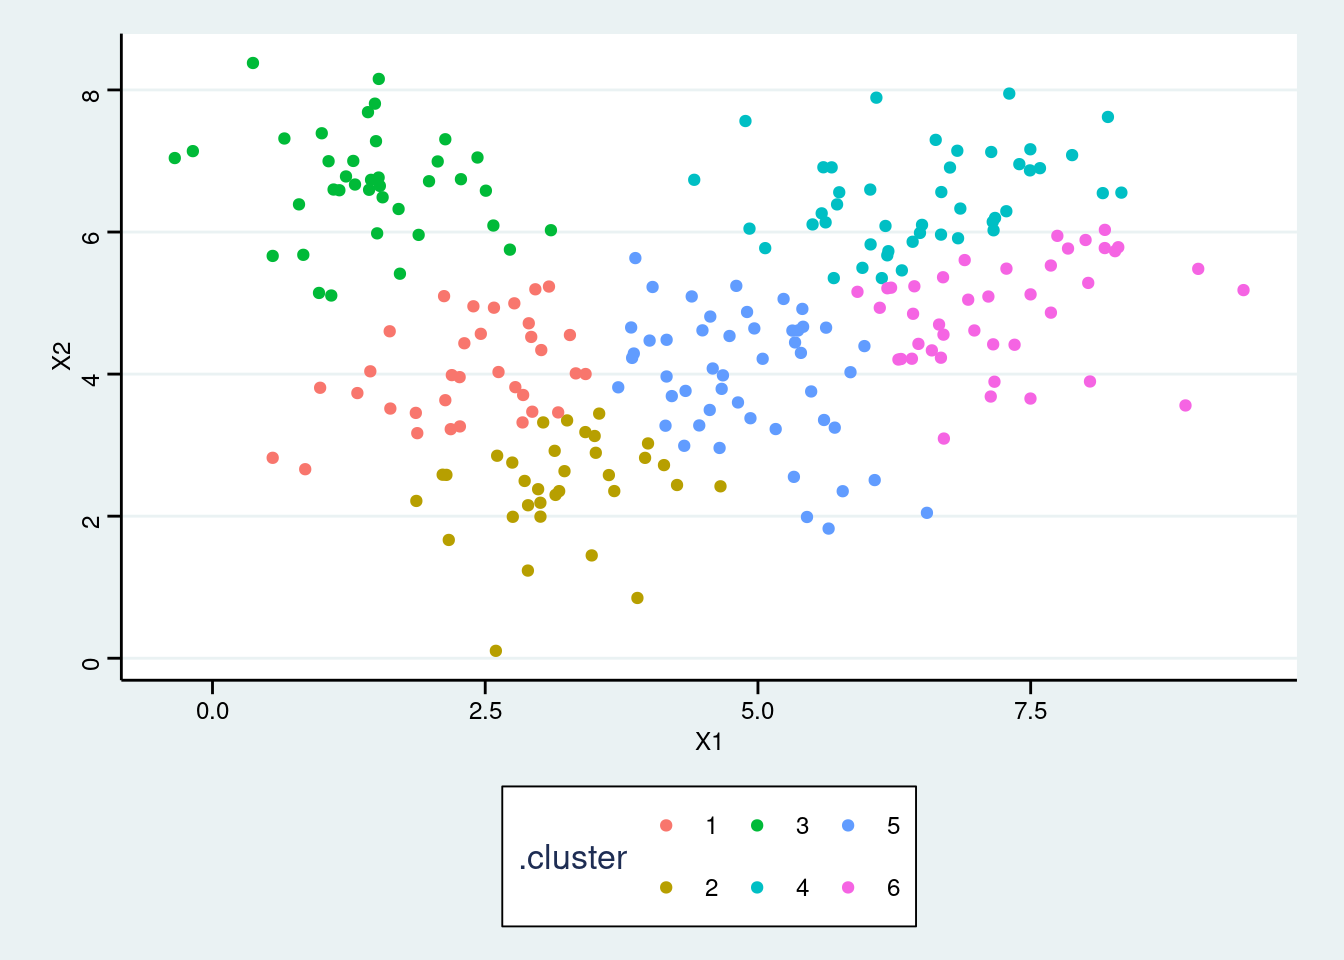
- Repeat parts b-c for identifying more number of clusters than what you picked in part a.
set.seed(1234)
res_kmeans <- kmeans(my_df, centers = 8, nstart = 25)augment(res_kmeans, data = my_df) %>%
ggplot(aes(X1, X2, color = .cluster)) +
geom_point()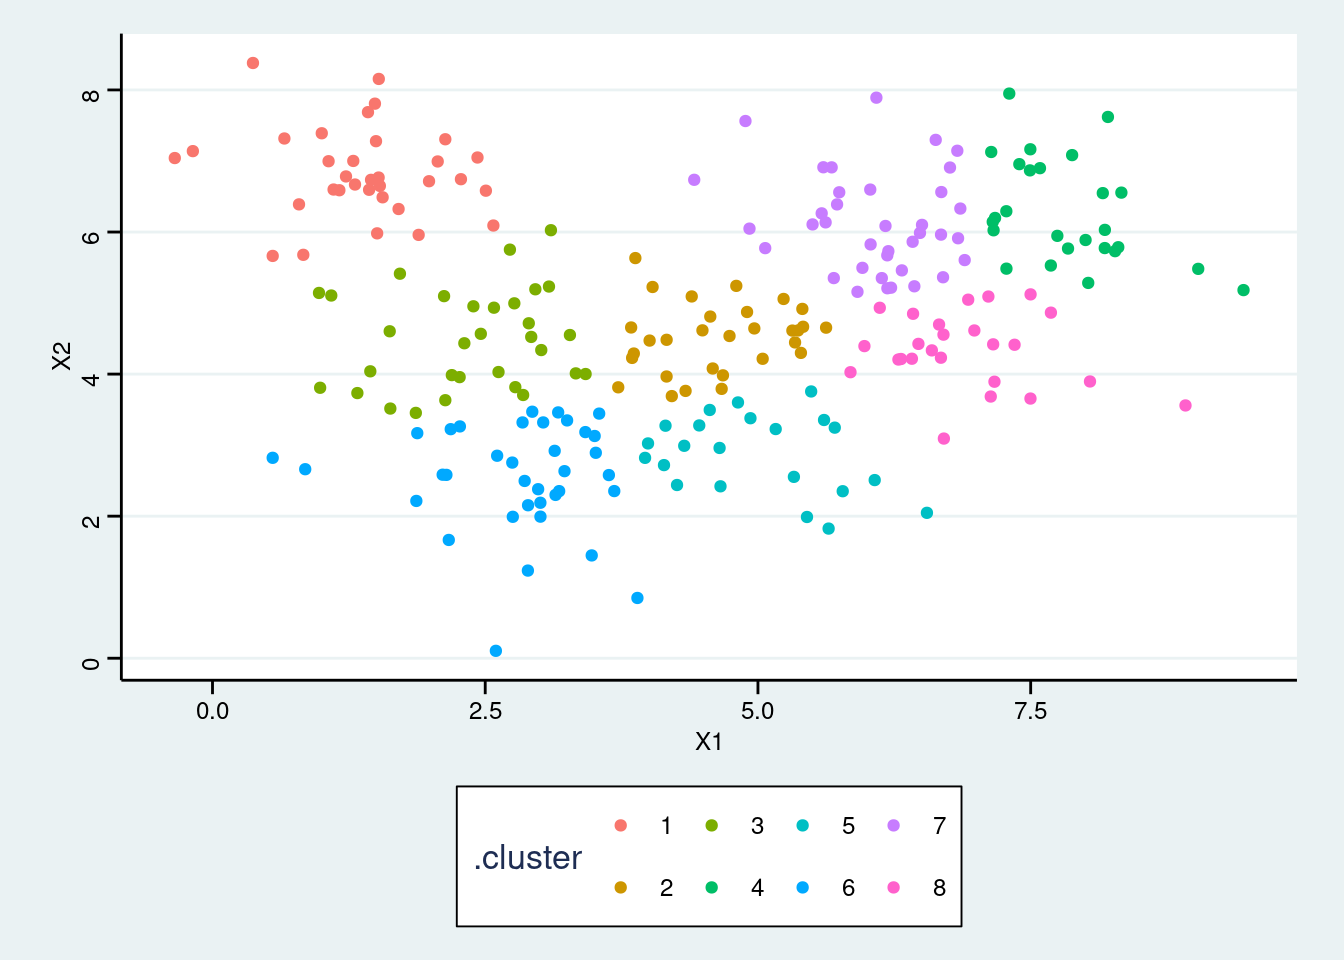
- Aggregate the total within sum of squares for each k to the data table
multi_kmeans.
multi_kmeans <- tibble(k = 1:15) %>%
  mutate(
    model = purrr::map(k, ~ kmeans(my_df, centers = .x, nstart = 25)),
    tot.withinss = purrr::map_dbl(model, ~ glance(.x)$tot.withinss)
)- Make an elbow plot modifying the code below:
multi_kmeans %>%
  ggplot(aes(k, tot.withinss)) +
  geom_point() +
  geom_line() +
  scale_x_continuous(breaks = 1:15)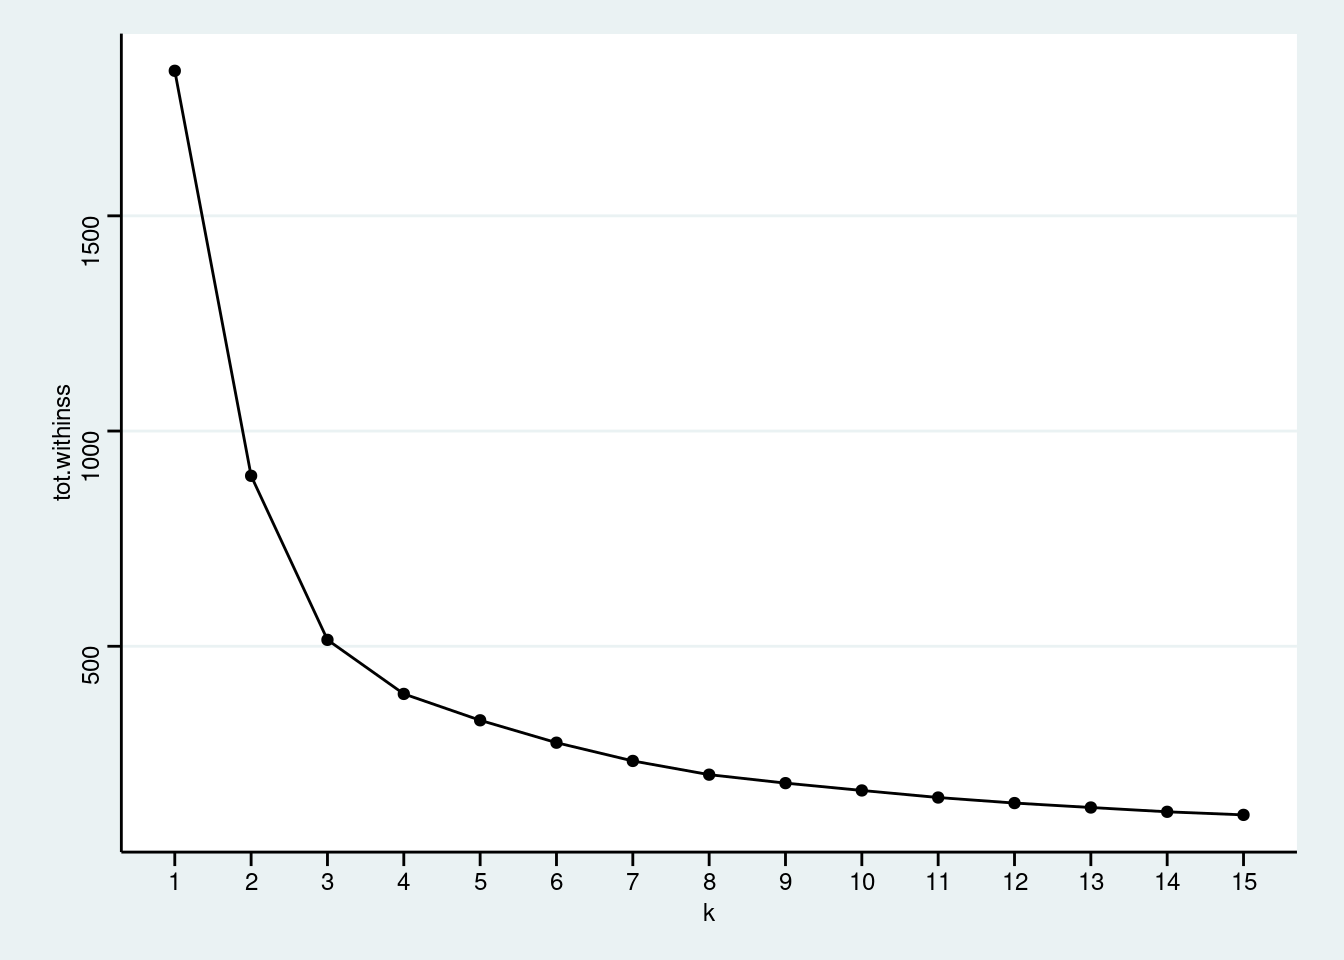
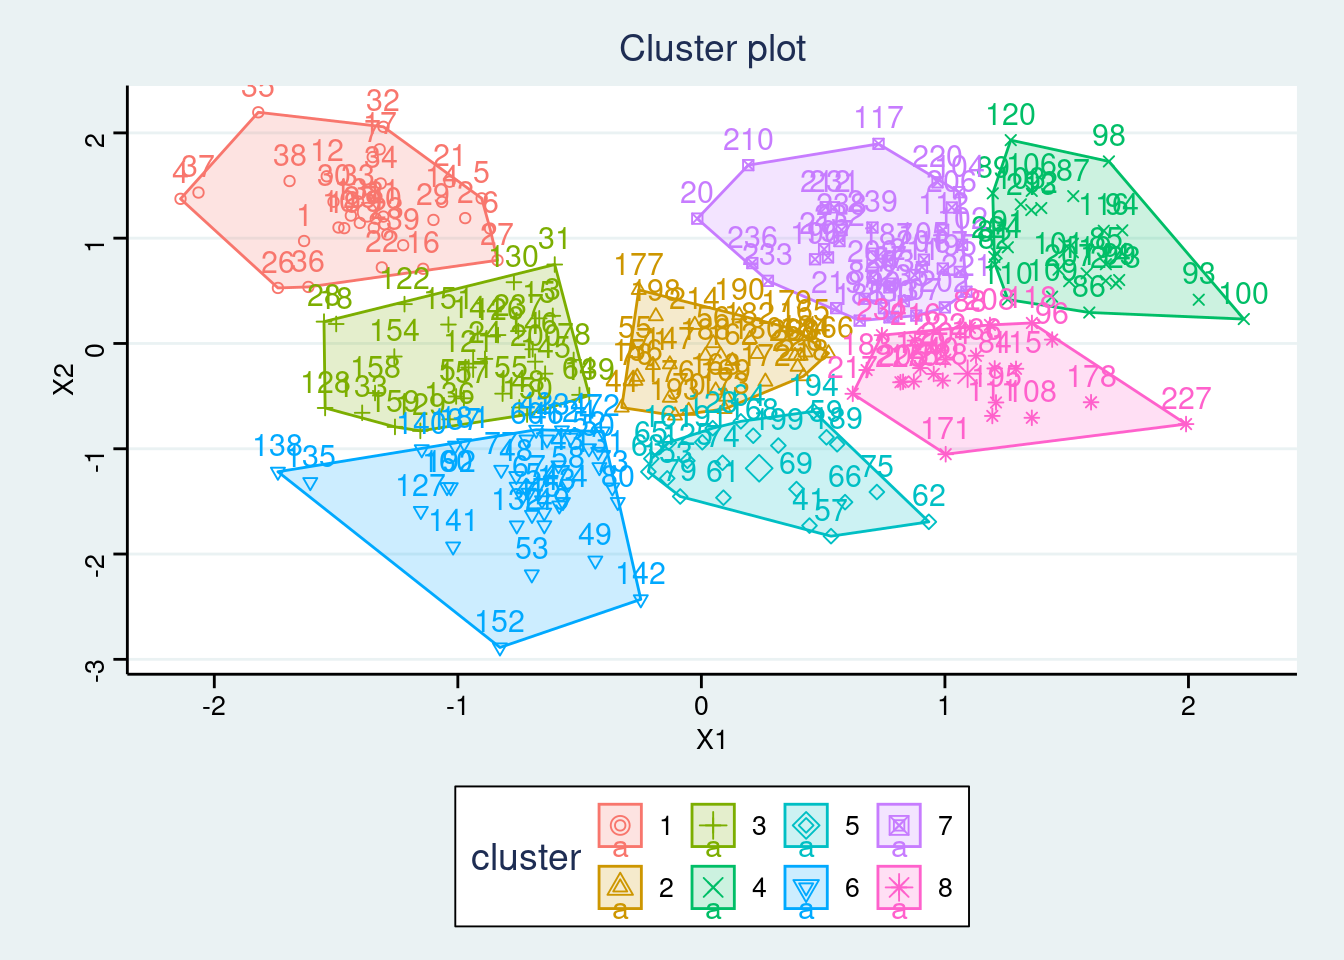
- After picking an optimal number of cluster, use the in-built function in the
factoextrapackage to construct the final cluster plot.
set.seed(1234)
kmeans.final <- kmeans(my_df, 8, nstart = 25)
fviz_cluster(kmeans.final, data = my_df, ggtheme = theme_stata())